Introduction
What is SmartMeter.io
SmartMeter.io is a multi-platform load and performance testing tool featuring fast and easy test creation and execution, test management and generating of test reports with focus on testing in a distributed mode.
SmartMeter.io is based on Apache JMeter but adds new features such as one-click test reports, advanced scenario recorder, user friendly distributed mode, acceptance criteria and many others. If you are new to JMeter, we recommend to start with JMeter documentation first.
How to start
Start by downloading SmartMeter.io here and then obtain your free license on the same page. To create your first performance test, navigate to Getting Started.
Recommended hardware
| Controller | Generator (min/optimum) | |
| RAM [GB] | 6 | 4/6 |
| HDD [GB] | 120 | 40 |
| CPU [cores] | 4 | 2/4 |
Software requirements
- 64-bit operating system
- Windows, Linux or OS X
- Java is already embedded in SmartMeter.io
More learning resources
Getting Started
This chapter will guide you through a basic workflow of using SmartMeter.io. We assume that SmartMeter.io is already installed. If not, please see How to start first and then get back here.
TIP: You can also watch video tutorials which cover test creation, editing and execution.
Welcome screen
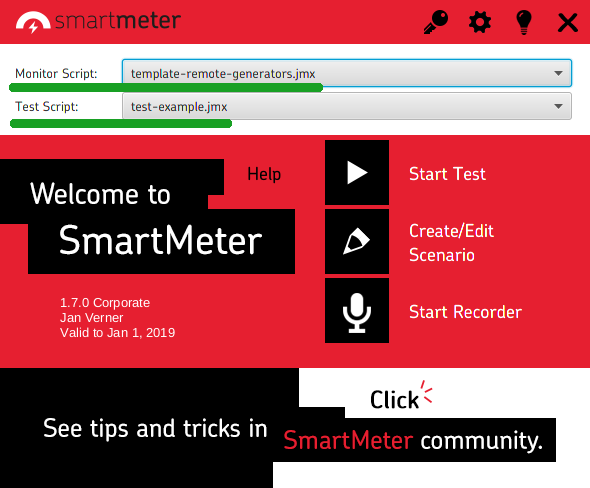
Navigate to SmartMeter.io home folder and run SmartMeter.exe (.sh on Linux and Mac). Welcome screen will start.
Run example test
Keep default values (empty Monitor scirpt and test.jmx for Test script), click Start test and wait until SmartMeter.io starts. The test will start automatically.
The test will run for the set period of time or untill you stop it by clicking in the left upper corner. Once the test is finished, click
to generate the test report. Report will automatically open in your default browser.
Basic test components
The following figure shows the tree structure of a typical test script. We highly recommend to read Elements of a Test Plan first.
- Test Plan - executable part of test script
- HTTP Cookie Manager
- HTTP Request Defaults
- VirtualUsers - Group of virtual users (technically threads). Virtual users iterate through their child components.
- 001_Homepage - Transaction grouping HTTP requests into a single measurable unit.
- 1 /university - The HTTP request to /university (main HTML document)
- 001_Homepage-http://academy.smartmeter.io-Resources - HTTP requests to homepage static resources (images, style sheets, scripts, ..)
- Think time - Pause before the virtual user will move to the next transaction. Simulates real-user behavior.
- 001_Homepage - Transaction grouping HTTP requests into a single measurable unit.
- Controller Summary Report - The only necessary and also mandatory listener.
- View Results Tree
- PerfMon localhost - Listener for measuring utilization of system resources (CPU, RAM, ..)
- Criterion No Errors - One of acceptance criteria examples
- WorkBench - utility components
- Recording log - full details of HTTP request/responses from recording time
Record test script
Navigate back to Welcome screen and click Start Recorder button and wait until Recorder is started.
*If running on OS X for the first time, you will need to add a security exception.
Keep default values for now and click Start recording button. Once SmartMeter.io homepage is loaded, navigate to Features page. The test script is being created as you browse the sites. Make few more transactions and click Save test button, confirm the end of recording and wait until editor is opened. It is often necessary to further modify scripts created by Recorder so they can be executed in many threads.
Continue reading this documentation, do not forget to checkout our blog and YouTube channel. If in trouble, contact us at customerservice@smartmeter.io, or even better at StackOverflow.
Electron Script Recorder
VIDEO: New Load Test Scenario Recorder in SmartMeter.io
Electron Recorder is a utility program which greatly helps with creating test scripts for webs and web application. It automatically captures all the HTTP(S) traffics between a client (web browser) and server and converts it into a test script. Here is the list of its key features:
- Simple to use (no proxy setup, no browser plugin, just start recording and get your test in just a few minutes),
- Always included Recording log (full details of HTTP request/responses),
- Automatic transactions and think times,
- Mobile devices simulation,
- Undo/Redo.
Create new test
Click Start Recorder on the Welcome screen.
-
Test name - Name of your newly created test scenario
-
URL of the tested site - The test scenario will start at the selected URL
-
You can choose if new transactions will be created automatically or by yourself
-
Request filter
-
The first option will record all requests
-
When the second option is selected, the recorder will collect resources only from the URL domain you have selected above
-
When the Advanced include is selected, new options will pop up.
-
-
Resolution - Your desired screen resolution. It’s suitable to test responsive version of the web, which should use different resources (images etc.).
-
User Agent Override - This will allow you to change setting of the user agent, eg. different browser, operation system.
Include - use to include requests to specific URLs, using specified protocol. Place each expression on a separate line. You can use both include fields or just one depends on your needs. When you click on the Start Recording button, content of this field is automatically transformed into regular expression. It follows these rules:
-
If you write only domain (e.g. google.com), every request and response with URL containing this domain will be recorded, including URLs like apis.google.com. Both protocols (HTTP and HTTPS) will be captured.
-
If you also specify a subdomain (e.g. www.google.com), only communication under this exact URL will be recorded using still both protocols (e.g. apis.google.com would be ignored).
-
If you write the whole URL (e.g. https://www.google.com), only communication on given protocol (here HTTPS) and under given URL (www.google.com) will be recorded. Everything other will be ignored. This happens when you copy & paste URLs so just keep in mind that by this you are putting restrictions on the Recorder and thus the recorded test doesn't have to correspond to the real user behavior.
Exclude - use to ignore requests to specific URLs. Suitable for excluding requests to a subdomain or excluding e.g. pictures or icons (^.*\.ico) requests. They will not be part of the test. Use regular expressions and place each expression on a separate line.
Start Recording button - pressing this button will start recording. From this point all requests made in a built-in browser will be recorded as part of the test script. With respect to Exclude and Include fields values.
Test script Recorder
Once you set your settings, you are ready to begin with recording. Let's have a look at the GUI.
Recorder is used for creating test scripts scenarios, while browsing a website in a built-in browser. Recorded transactions are shown in the left sidebar. A transaction usually encapsulates a bulk of requests initiated by a single action on the website (for example clicking a link or submitting a form) or it may encapsulate more actions (for example login to a website).
Transaction card
-
“Plus” button - This button allows you to add a new transaction manually.
-
Transaction Title - It is recommended to name the transaction, so you have better idea what are you working with when editing the scenario.
-
Sleep time - It is counted automatically and also can be set manually. It represent time period before another transaction which simulates human clicks on the site.
-
Info bar - Shows information like number of request, size and response time.
-
Pause / Unpause sleep - Toggle button which is used for stopping the Sleep timer.
-
Remove button is used for deleting the transaction.
Main window
The main window in the GUI consists of three parts. Browser, Transaction detail and Search resources.
-
Browser - If you wish to record a script, use this built-in browser. Each step you perform, will be recorded as a transaction.
-
Transaction detail - This will give you a full detail about each recorded HTTP request/response.
-
Search resources - Allows you to search information through the test scenario.
Transaction detail
Transaction detail table shows all the resources recorded in a particular transaction. The omitted ones by the exclude filter are tinged by gray. You can show/hide excluded resources by the checkbox at the top right corner. To show additional details (request / response headers, response body), click on the resource row.
Save script
When you are finished with the test script, move on to the editor. On the right top side, there is a main menu which contains elements to work with the scenario.
-
Save the test - Test scenario is saved in a JSON format and then converted to SmartMeter.io (.jmx) format. Once saved, new window will appear with the possibility of opening the JMeter based editor, for editing the script and running the test. Scripts are by default saved to tests folder.
-
Test settings - Same window as in the beginning will pop up, however you can only rename the test, change resolution or manage resources filter.
-
Flush cache - This allows you to clean the cache, which will simulate the first visit on the website.
-
Undo / Redo button - Serve as expected for undoing/redoing the last action performed.
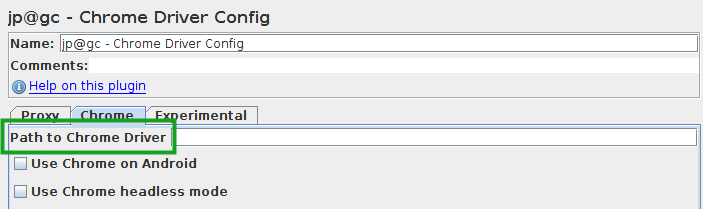
Chrome Script Recorder
This is the original test script recorder which was replaced by Electron Script Recorder in SmartMeter.io 1.2.0.
Removed completely in 1.7.0.
Installed Chromium/Chrome is required for Linux and OS X.
Recorder is used to easily create test scripts while browsing a website. Recorder captures user requests and server responses from the Chrome / Chromium web browser (this is done with Recorder plugin). We recommend to work with transactions. A transaction usually encapsulates a bulk of requests initiated by a single action on the website (for example clicking a link or submitting a form) or it may encapsulate more actions (for example login to website).
Consider cleaning the browser cache before recording the script (Google Chrome shortcut is CTRL + SHIFT + DEL). If the cache is clean, it simulates the first time visit. On the other hand, if you firstly browse the tested web and will not clean the cache afterwards, you may simulate load caused by a regular visitor. Recorder runs on port 8090, if you want to quickly verify that Recorder is running, we recommend open "localhost:8090/Recorder/recorder".
Click Start Recorder on the Welcome screen.
The figure below shows the Recorder control panel after its start.
- Exclude field - use to ignore requests to specific URLs. Suitable for excluding requests to a subdomain or excluding e.g. pictures or icons (^.*\.ico) requests. They will not be part of the test. Use regular expressions and place each expression on a separate line.
- Include (URL address) field - use to include requests to specific URLs, using specified protocol. Place each expression on a separate line. You can use both include fields or just one depends on your needs. When you click on the Start Recording button, content of this field is automatically transformed into regular expression. It follows these rules:
- If you write only domain (e.g. google.com), every request and response with URL containing this domain will be recorded, including URLs like apis.google.com. Both protocols (HTTP and HTTPS) will be captured.
- If you also specify the World Wide Web prefix (e.g. www.google.com), only communication under this exact URL will be recorded using still both protocols (e.g. apis.google.com would be ignored).
- If you write the whole URL (e.g. https://www.google.com), only communication on given protocol (here HTTPS) and under given URL (www.google.com) will be recorded. Everything other will be ignored. This happens when you copy & paste URLs so just keep in mind that by this you are putting restrictions on the Recorder and thus the recorded test doesn't have to correspond to the real user behavior.
- Include (regex) field - use to include requests to specific URLs. See the example below the field. This example regular expression defines an exclusive inclusion of links from the example.com domain. All request to different domains will be therefore ignored (for example requests related to Google Analytics). Place each expression on a separate line. You can use both include fields or just one depends on your needs.
- Start Recording button - pressing this button will start recording. Also transforms content of the URL address include field into regular expression. From this point on all requests made in the Chrome / Chromium browser will be recorded as part of the test script. With respect to Exclude and Include fields values. After pressing the Start recording button the information "For full recording log press F12 in Chrome Browser!" is displayed. Pressing F12 will open the Developer toolbar. This is not necessary but strongly recommended in order to capture complete requests and response data. Without opened Developer toolbar there will be no Recording log available later in test scenario.
After pressing the Start recording button, the control pane will look like on the figure below:
- Stop recording button - finishes the recording process. Press when your are done with the test script. No more requests will be then recorded.
- Transaction name field - enter a name of transaction here. Transactions are explained in more detail at the beginning of this sub chapter.
- Start transaction button - starts a new transaction. Transaction is named accordingly to Transaction name field (2). After starting the transaction it is the right time to perform an action in a browser.
- Stop transaction button - ends the current transaction (press after your action in browser is completed).
- Sleep field - enter the time (in seconds) a user is supposed to wait after performing the transaction.
- Insert sleep button - inserts the sleep time from Sleep field (5) into the test script.
Basic workflow
Chrome Script Recorder has two parts - Recorder control panel and web browser. The control panel controls the recording process (settings, start, stop and so on) while the browser captures your activity and converts it into a test script. First fill one of the include fields (either insert URL, or regular expression) by SmartMeter.io homepage. The content of include fields specify protocol and domain which will be recorded.
Leave the rest of the fields blank for now and just click on Start Recording button. You will be prompted to open Developer toolbar. This is recommended because developer toolbar allows Recorder to capture bodies of requests and responses. Click on OK to dismiss the dialog and in Recorder web browser hit F12 key.
You will be notified about transactions. Name your first transaction for example "SmartMeter.io Homepage" and click on the button Start Transaction. Now all recorded communication will be also logically wrapped under this transaction name until you click on Stop Transaction. Recorded transactions are visible as lines in most graphs during the run of a test. Transaction logically represent one user action. Therefore by using transactions you can organize your test according to your needs. Now it is finally time to record our first test!
Focus on the browser now (Chromium on Windows / Linux, Chrome on Mac). Make sure that you are using the browser launched by Recorder. Do not use your standard browser. It will not work since it does not have the necessary plugins loaded! Visit https://www.smartmeter.io/. When the site is fully loaded click on Stop Transaction. You should see list of recorded https requests wrapped under the transaction name in Recorded scenario box.
Now let's record one more transaction so there can be some comparison during the analysis of the test. The procedure is the same as before. Name your transaction for example "SmartMeter.io Blog", click on Start Transaction, in browser click on the link Block in the menu and when the page loads click on Stop Transaction. You should end up with two lists of recorded requests.
Now you have recorded all you need and you can click on Stop Recording button and confirm your choice. Two new input fields will appear. Set number of concurrent users to 5 and test duration to 60 (secs). Create the test by clicking on Create & Edit test.
After a short while, JMeter based editor will be launched. You may close it right away since we do not want to make any changes in this most simple scenario. You may close Recorder and web browser as well and then switch back to Welcome screen.
Tip: More advanced tutorial on how to record a test is available on our blog and also on YouTube.
Recorder extension API
Following features are related to Recorder and can greatly reduce the amount of manual work while preparing the test. The idea behind is to set some rules before recording the test. Those rules are then evaluated for each request. Nice example is a rule for extracting some values from a response and using it in the following requests.
In case you are writing a custom extension in Java, put the JAR with compiled classes into the custom folder and register the component (replacer, correlator or assertion) in custom/smartmeter.properties using the fully qualified name of the component (for example foo.bar.MyReplacer).
Replacing dynamic values in requests
Some parts of a request might be dynamic and must be changed with each test run or even with each new request (for example a timestamp or some one-time tokens). We can split such dynamic values in two groups. The first one contains dynamic values which can be easily generated (a timestamp). The second one is a little bit more complicated because the dynamic values must be extracted first from a response (typically some one-time verification tokens). If you are interested in the second group, see Automatic correlations after reading this chapter.
Values can be replaced in URL, request headers or body. The original value is removed and replaced with a placeholder (${PLACEHOLDER}).
Create your own replacer by implementing the cz.etnetera.jmeter.recorder.replacement.Replacer interface which is part of the Recorder API (located in programs/SmartMeter/extras/RecorderInterfaces.jar). Put the custom replacer (packaged as JAR) into the custom folder in the root of the SmartMeter directory. Do not forget to register the custom replacer in Configurator (tab Recorder, parameter etn_recorder_replacers) using its fully qualified name.
Example - substitution of timestamp parameter in URL
etn_recorder_replacers = cz.etnetera.smartmeter.replacer.timestamp.TimeStampReplacer
import java.util.regex.Pattern;
import cz.etnetera.smartmeter.recorder.replacement.ReplaceType;
import cz.etnetera.smartmeter.recorder.replacement.Replacer;

public class TimeStampReplacer implements Replacer {

	private static final String TS_PARAM = "_ts=";
	private static final String PARAM_DELIMITER = "&";
	private static final String VAR_NAME = "${timestamp}";

	@Override
	public String replace(final ReplaceType type, String text) {
		if (ReplaceType.PATH.equals(type) && text != null && text.contains(TS_PARAM)) {
			String replace = text.split(Pattern.quote(TS_PARAM))[1];
			if (replace.contains(PARAM_DELIMITER)) {
				replace = replace.split(Pattern.quote(PARAM_DELIMITER))[0];
				text = text.replace(TS_PARAM + replace + PARAM_DELIMITER, TS_PARAM + VAR_NAME + PARAM_DELIMITER);
			}
		}
		return text;
	}
}
Automatic correlations
Automatic correlations extend the capability of Replacing dynamic values in requests by automatically extracting the dynamic parts from a response. All future occurrences of such values in requests are replaced with a placeholder (variable).
Note: The test scenario must contain the Recording log (activated by pressing F12 before its recording)!
Built-in correlation mechanisms
- cz.etnetera.jmeter.recorder.correlation.BoundaryExtractorCollerator - extracts values using left and right borders. Configure either in Configurator or directly by editing custom/smartmeter.properties.
Example - automatic correlation of Vaadin security key
Example of response containing Vaadin security key:
{
  "v-uiId":2,
  "uidl":"{\"Vaadin-Security-Key\":\"bda6f482-785b-4c67-a7d9-cbc5c3b679ee\"}"
}
We want to ensure automatic correlation of value bda6f482-785b-4c67-a7d9-cbc5c3b679ee by replacing it in future requests with variable ${Vaadin-Security-Key} and inserting Boundary Body Extractor to the point where the value is to be retrieved. Boundary body extractor uses the left and right boundary (highlighted in bold) to extract the key.
Add the following configuration to custom/smartmeter.properties (or use Configurator)
# register correlation
etn_recorder_correlations = vaadin_seckey
# definition of used mechanism, may be the path to its own Correlator implementation,
# separated by a semicolon
etn_recorder_correlation_vaadin_seckey_mechanism = BoundaryExtractor
# variable name that will be used in the test.
# If multiple instances of correlation were found, the variable will be automatically numbered
etn_recorder_correlation_vaadin_seckey_varName = Vaadin-Security-Key
# left border of correlated variable in the response
etn_recorder_correlation_vaadin_seckey_lb = Vaadin-Security-Key\":\"
# right border of correlated variable in the response
etn_recorder_correlation_vaadin_seckey_rb = \"
# order of occurrence
etn_recorder_correlation_vaadin_seckey_match = 1
Example - custom correlator
The custom correlator is suitable for more complex cases. For example when the left / right border changes between responses. Imagine a button which description or identifier changes according the page on which it appears.
The process of creating a custom correlator is analogous to creating a custom replacer. Your custom correlator must implement the cz.etnetera.smartmeter.recorder.correlation.Correlator interface. Do not forget to register the custom correlator in the Configurator (tab Recorder, parameter etn_recorder_correlations).
Example
import cz.etnetera.smartmeter.recorder.correlation.BoundaryExtractorSettings;
import cz.etnetera.smartmeter.recorder.correlation.CorrelationResult;
import cz.etnetera.smartmeter.recorder.correlation.Correlator;

public class ExampleCorrelator implements Correlator {

	private static final String LB = "value=\"";
	private static final String VAR_NAME = "action";
	private static final List actions = new ArrayList();

	static {
		actions.add("\" >Login");
		actions.add("\" >Registrovat");
	}

	@Override
	public CorrelationResult find(final String correlation, final String content, final Map, String> headers) {
		for (final String action : actions) {
			// nalezneme, ktera z uvedenych akci je pritomna na strance
			if (content != null && content.contains(action) && content.contains(LB)) {
				try {
					// najdeme promennou, kterou chceme pro nahrany scenar nahradit
					final String value = content.split(Pattern.quote(LB))[1].split(Pattern.quote(action))[0];
					// vratime vysledek, obsahujici nazev promenne, hodnoty k nahrazeni a nastaveni extractoru
					return new CorrelationResult(VAR_NAME, value, new BoundaryExtractorSettings(VAR_NAME, LB, action, 1));
				} catch (final ArrayIndexOutOfBoundsException t) {
					return null;
				}
			}
		}
		return null;
	}
}
Response assertions
The process of creating a custom assertion is analogous to creating a custom replacer. Your custom assertion must implement the cz.etnetera.smartmeter.recorder.correlation.Assertion interface. Do not forget to register the custom assertion in the Configurator (tab Recorder, parameter etn_recorder_assertions).
Built-in assertions
- cz.etnetera.jmeter.recorder.assertion.TitleAssertion - adds automatic asserts on <title> tag.
Test Report
SmartMeter.io offers detailed HTML test reports at one-click. Once the test is finished, click the on main toolbar. The report will open automatically in your default web browser. Reports are by default saved to reports folder. Data for report are taken from et@sm - Controller Summary Report.
Result Analysis
See example
- Test script - backup of test script, for easy retesting
- Results backup - archive with raw test results (JTL)
- Test duration
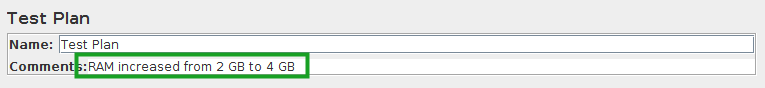
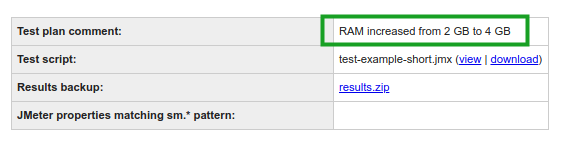
- Test plan comment - custom test plan comment, great for saving additional information about this test run (tuning trials, state of database, ..), can be edited even during the test
- Active Thread Groups - virtual users configuration
- Statistics Summary - maximum number of virtual users, total hits, average hits per second, total errors
- Requests Summary - statistical overview of all requests/transactions
- Successful Requests Summary
- Failed Requests Summary
- Responses Summary - overview of HTTP response codes and/or exceptions
- Errors - overview of errors, with links to full detail about the error
- Acceptance criteria - evaluation of acceptance criteria
- Graphs
Trend Analysis
Since 1.4.0
Long-term comparison of repeated test runs.
Trend Analysis works out of the box. SmartMeter.io automatically detects previous test runs in reports folder and uses them for comparison. Test runs are grouped by test script name (name of the .jmx file). In case of major changes in the test script we recommend to version its name to start from fresh.
If you want to exclude a test run from comparison, either remove its report folder or delete the data/test-summary.json file from it.
Backups
SmartMeter.io automatically backups the test script (.jmx) file and archive of result files (.jtl) to REPORT/backups folder. You can easily run the same test again or analyze the test logs in more depth.
JSON Data
Report data are also available in JSON format in REPORT/data/test-summary.json.
Additional report generation
Usually, you generate the report after the test, but this is not the only option. You can also use et@sm - Report Generator component or run generateReport from command line to generate the report at any time (even in a batch).
Test plan comments
Comments for Test Plan are copied to test report.
CLI sm. properties
JMeter can read properties from command line. This is super handy in combination with CI (to dynamically define number of virtual users or test duration). However, this is information is lost after the test. Therefore SmartMeter copies all properties prefixed with sm. to test report.

Configuration
Extra configuration options are available in Configurator - tabs report and report-graphs.
TIP: Generating a report after a long-running distributed test can take a lot of time. You can speed things up if omitting some of the graphs (property etn_report_create_graphs).
Graphs Overview
This chapter describes essential performance testing metrics to give you insight while analyzing the test results.
Hits Per Second
Sum of all processed requests (to be more precise - every called sampler) to a server per second. The hit is not counted until the server responds.
The shape of this graph should be approximately the same as the Threads State Over Time graph, which captures the loading of virtual users.
What to look for:
-
There is a substantial decrease of hits at a specific moment. That means the tested system system is getting overloaded or even fails to respond.
Relationship:
- When the response time increase (Response Times Over Time graph) this graph decrease.
Response Codes Per Second
Types of response codes sent from a server at a specific time.
Response codes 500 mean that there are errors in the tested system.
What to look for:
-
There are both 200 and 500 response codes in the graph. That indicates that only a part of the system is no longer able to respond while the other part is still functional. The system might be using a load balancer or two backends and one of them stopped working.
-
Compared to a previous test run there is a substantial increase in the number of responses with redirect code 301 or 302. That indicates that some changes were made in in the system since the last test run.
Relationship:
-
When the number of hits decrease (the server wasn’t able to respond) the response time (Response Times Over Time graph) increase.
Response Times Over Time
The graph shows a response time for requests within transactions (test step in a test scenario).
Each transaction usually includes more requests to a server. In a perfect state this graph would be horizontal and flat.
What to look for:
-
One of the transactions suddenly takes longer time to respond while others doesn’t. That indicates the reason is specific to the one transaction only and not to the system as a whole.
- All transactions have slow response (graph peaks) in regular intervals. That might indicate regular task on the server and not an error.
Response Times Over Time Aggregate
The graph shows aggregate response time of all requests.
In the perfect state the graph closely copies the X axis.
Substantial response time increase (peak) is easier to spot in this aggregate view than in separate view (Response Times Over Time graph).
It is also easier to spot periodic deviations in response time, which might be caused by regular system tasks and not by an error.
Threads State Over Time
The number of all active virtual users. Shown separately for each thread group and generator.
The graph confirms that virtual users were really generated as defined.
Users are divided according to load generators and activities they perform (first group only visits the index page, second group is signing in etc.).
What to look for:
- The graph has different shape than which was defined during test editing.
Threads State Over Time Aggregate
The sum of all active virtual users.
The graph confirms that virtual users were really generated as defined.
What to look for:
-
The graph has different shape than which was defined during test editing.
Transactions Per Second
How many times was each transaction called.
Transaction can be interpreted as a test step in a test scenario such as visit index page, insert product into cart, successful login, failed login,...
In a perfect state the graph increases the same way as the number of virtual users.
What to look for:
-
Virtual users keep increasing and the system is no longer able to process every transaction. The graph stops to increase.
Transactions Per Second Aggregate
The sum of all completed transactions.
Transactions are divided into successful and failed.
Transaction can interpreted as a test step in a test scenario such as visit index page, insert product into cart, successful login, failed login,...
In a perfect state the graph increases the same way as the number of virtual users.
What to look for:
-
The graph stops to increase, because virtual users keep increasing and the system is no longer able to process every transaction.
- There are many failed transactions in the graph.
Concurrency Over Time
The number of concurrent threads hitting the server.
The requests that the system is unable to process start forming a queue, which is represented in this graph. The size of the queue is limited by system resources and after some point errors start to occur.
NOTE: This graph is turned off by default because its creation is very time-consuming.
What to look for:
-
The number of concurrent threads increases considerably faster than the number of virtual users (Threads State Over Time Aggregate graph). That indicates the system is unable to respond and the requests pile up.
- If these peaks occur in regular intervals, they may not indicate and error but an unrelated planned system task, for instance.
Concurrency Over Time Aggregate
An aggregate view on the number of concurrent threads hitting the server.
Threads are divided to successful and failed. Graph can also be used when testing two different systems within one test.
Bytes Throughput Over Time
Received and Sent Bytes per second.
The shape of this graph should be approximately the same as the Threads State Over Time graph, which captures loading of virtual users.
What to look for:
-
The graph doesn’t copy the load of virtual users. System ran out of resources or the max network throughput was reached.
Response Times Percentiles
How many percents of requests reached a given speed (e.g., 60 % of requests were processed within 10 seconds).
Every transaction from the scenario is displayed separately.
note: There is an error on the X axis. Instead of time it should show percents (10 %, 20 %,30 %,…, 100 %
Response Times Percentiles Aggregate
How many percents of requests reached a given speed (e.g., 60 % of requests were processed within 10 seconds).
Transactions are shown in an aggregate view.
note: There is a mistake on the X axis. Instead of time it should show percents (10 %, 20 %,30 %,…, 100 %).
PerfMon
System resources utilization on Controller, generators or any other monitored environment.
-
CPU in %
-
Disc memory used in %
-
Memory used in %
- Network I/O in MB
What to look for:
-
When the CPU is overloaded, test results will not be accurate. To get reliable results for the test with same settings it is necessary to add more HW resources.
- It is also possible to run a test without real-time graphs to save HW resources. (the Concurrency Over Time is particularly resource demanding).
Distributed Mode
A single computer simply cannot provide enough power when simulating large numbers of virtual users. The solution is to connect more computers together and create a distributed network. This, of course, creates many obstacles such as correct environment setup, secure communication between nodes, concurrency, combining the test results together and managing the whole process overall. The good news is that SmartMeter.io is specifically designed to run in a distributed mode and it possesses the capability to resolve all of the above issues with ease. All you have to do is pick one of the predefined monitor scripts and configure your environments specific variables.
The following picture shows the general architecture of distributed testing.
- Monitor - Instance of SmartMeter running the monitor script
- sets up the distributed environment (load generators, Controller, DataServer and agents)
- displays real-time data from agents (system resources monitoring)
- Controller - Instance of SmartMeter running the test script. It is started by the Monitor.
- starts/stops the test
- sends the test script to load generators
- display real-time test results (response times, throughput, ..)
- collects and merges full test results after the test
- generates the test report
- Generators - Multiple instances of SmartMeter running in the server (slave) mode. Use more load generators to increase the maximum number of virtual users and increase the test reliability.
- executes the test script and thus generates the load
- sends real-time data back to the Controller
- sends full results back to the Controller after the test
- Tested system - System under test (SUT)
- Data server - Data server provides data for load generators. It is usually hosted on Controller. It solves the issue of splitting and copying CSV data files to load generators.
- Agent (PerfMon) - Utility application that monitors system resource consumption (typically CPU, RAM, IO, and networking) and reports information back to the Monitor. More information can be found in the PerfMon Server Agent´s documentation http://jmeter-plugins.org/wiki/PerfMonAgent/.
Controller automatically transfers the test script to all load generators and starts the test. Once the test begins, Controller starts receiving live test results from the load generators. Once the test is finished, full test results are automatically downloaded from the load generators and merged into a single log file. The test report is created with one click.
NOTE: Always use the same version of SmartMeter.io for Controller and load generators!
Read more on on remote testing in JMeter Documentation.
VIDEO: Web performance and load (stress) testing process with SmartMeter.io
Monitor script
Each distributed test consists of a monitor script and a test script.
Monitor script and test script are two separate JMX files. Monitor script is responsible for setting up the distributed environment. It starts load generators (requires SSH), DataServer, performance monitoring agents and finally the Controller which is running the real test script). Monitor is a running instance of SmartMeter.io executing the monitor script, usually with a single thread. It runs on the same machine as the Controller.
Optionally, Monitor can start an actual Internet browser and measure the speed of loading and rendering the page from a real users perspective. Monitor script is a standard script (.jmx) and is created/edited in SmartMeter.io editor.
Test script is a standard script and does not differ from the non-distributed test in any way.
Monitor script templates
Folder tests/monitors contains a bunch of predefined monitor scripts for common scenarios.
- template-remote-generators.jmx - Distributed testing from multiple machines without SSH (Windows). Load generators must be started manually.
- template-remote-SSH-generators.jmx - Distributed testing from multiple machines utilizing SSH for starting load generators (Linux). Firewall must configured to allow the required ports.
- template-remote-SSH-tunnel-generators.jmx - Distributed testing from multiple machines utilizing SSH for starting load generators and also for tunneling communication between Controller and load generators. Firewall is bypassed.
- example-local-generators.jmx - Distributed testing from a single machine with multiple SmartMeter instances. Rather for experimenting and prototyping.
- example-remote-SSH-tunnel-generators.jmx - Real-world example. Will not work on your machine! Just to see an example configuration.
The following picture shows template-remote-generators.jmx.
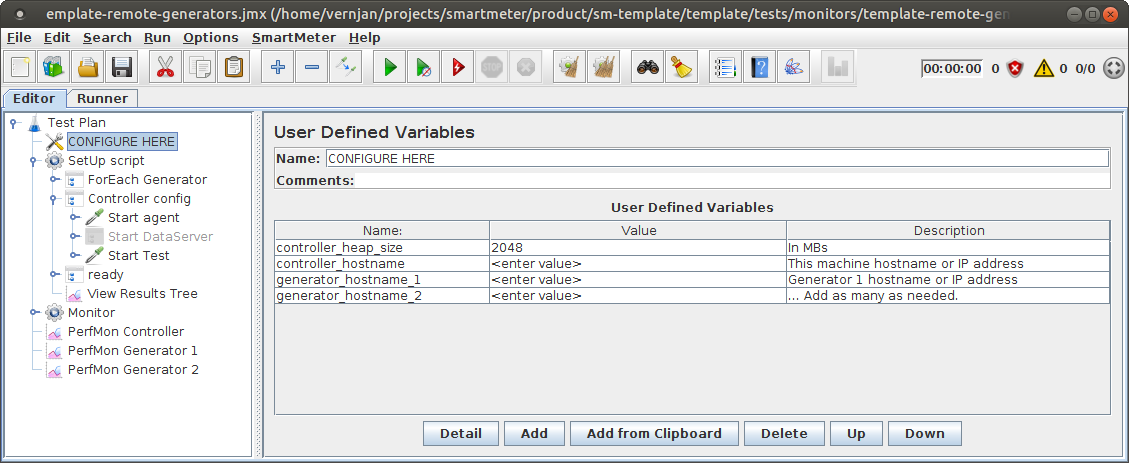
Usually, the CONFIGURE HERE element is all what you need to adjust. Enter the IP/hostname of your machine (the Controller) and IPs/hostnames of load generators. For advanced configuration see children of the SetUp script element (for example to configure the DataServer).
Running distributed test
- Copy the same version of SmartMeter to the Controller and all load generators.
- If not using one of SSH monitor scripts, start every load generator manually using bin/runGenerator.bat. You may need to edit the script first. Look inside and follow the hints.
- Make sure generators are running
- 2 Java processes are running (the load generator and the PerfMon agent)
- view log file logs/generator.log, the last line should be
o.a.j.e.RemoteJMeterEngineImpl: Bound to RMI registry on port 1099
- Start the distributed test from Welcome screen. Select both the monitor and test script and then click the Start Test button. Do not start distributed tests from SmartMeter editor.
Following series of actions describes the standard life cycle of distributed test. The italic steps are optional.
- Monitor is started and immediately executes the monitor script.
- SSH connections to remote servers hosting load generators is established.
- PerfMons (agents) and load generators are started on the remotes server.
- PerfMon is started locally.
- DataServer is started and populated with test data.
- The controller with test script is started.
- Monitor keeps on running and display data from agents (CPU, memory, disks and I/O load).
- Controller is started and immediately executes the test script.
- Controller sends the test script to load generators.
- Generators simulate virtual users and sends live results back to the Controller.
- Controller displays real-time test results.
- When the test is finished, complete data are received from the load generators.
- Controller collects the test results from generators and makes the final report (this can take some time).
Remote Test Info window
This window shows the current state of the Controller and load generators and also the event log.
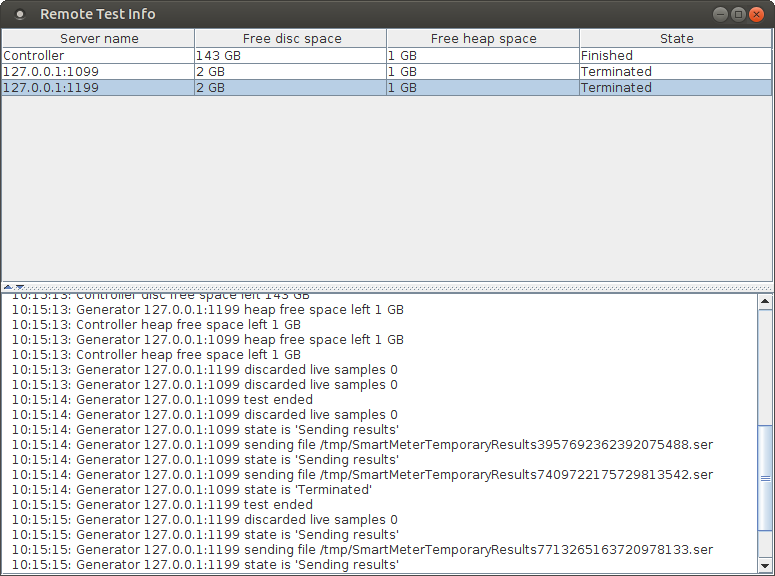
- Free disc space - An alert is displayed if less than 2 GB is available. Running out of disc space means incomplete test results!
- Free heap space - An alert is displayed if less than 256 MB is available. Running out of heap space means skewed test results (the response time is potentially much longer because of Java garbage collecting).
The event log is great for troubleshooting.
Geographical distribution
See et@sm - Distributed Concurrency Thread Group
Firewall configuration
The communication is bidirectional.
SmartMeter communicates on the following ports.
Open ports on Controller
| Service | Default value | How to change |
| RMI client - receives test results from load generators | 55512 | in monitor script in Start test component as RMI client localport, 0 is for random |
| DataServer | 8080 | in monitor script in Start DataServer component as tcp port |
Open ports on generators
| Service | Default value | How to change |
| RMI registry | 1099 | in bin/runGenerator script add -Dserver_port=PORT, in case of starting load generator via SSH in monitor script in Start remote generator component as server port (RMI registry) |
| RMI server - receives commands from the Controller | random | in bin/runGenerator script add server.rmi.localport=PORT, in case of starting load generator via SSH in monitor script in Start remote generator component as RMI server localport, 0 is for random |
| PerfMon Server Agent - measuring system resources utilization (CPU, RAM, ..) | 4443 | cannot be changed at this moment |
SSH tunneling
A firewall can be bypassed through SSH tunnels. See tests/monitors/template-remote-SSH-tunnel-generators.jmx. Because there is some extra overhead related to SSH tunneling and the set up is also more complicated, it is recommended to configure the firewall properly and avoid SSH tunneling.
Test results
Load generators processes test results in 2 steps:
- While the test is running: Results are saved to disc to system temp location (you can change this using
etn_temporary_results_pathproperty). Files can be easily recognized by the.serextension. - After test: Results are sent via RMI to the Controller. Controller assembles the .jtl file in results folder.
By default, successful samples are stripped of HTTP request headers and response headers and body. This can be configured with the following properties: etn_save_successful_sample_request_headers, etn_save_successful_sample_response_headers and etn_save_successful_sample_response_data. Failed samples are not stripped.
Live samples
SmartMeter uses live samples to provide real-time results. Live samples are stripped of all heavy data (HTTP headers, body, assertion messages) and send in batches to Controller. Live samples might be discarded if the load is heavy. Number of discarded live samples is logged in Remote test info window. Please note this does not skew the final report but the real-time results only.
DataServer
DataServer is a web application that provides and collects data during distributed tests. Its main purpose is to make sure that data are evenly distributed to generators and that each generator has its own unique data. Typical use case is virtual users’ login credentials.
Communication with DataServer is realised over standard HTTP requests. DataServer is usually started and populated from Monitor. Standard way of populating the server is from CSV files located in data folder. DataServer holds data in memory and is capable of holding thousands or even tens of thousands of records (depends on average size of one record). Proven throughput is 500 requests per second.
Starting DataServer
DataServer is preferably started from Monitor using RunDataServer Java command. After starting up, the server is available at http://localhost:8080/DataServer/data.
Another option is to start the server manually (executed from programs/DataServer, Java 8 is required).
java -server -Xms512M -Xmx2G -jar start.jar
Data population
DataServer is populated from HTTP GET request with following parameters:
- importFile - path to data file relative to test script or to SmartMeter home
- dataName - custom name of data bank
- random - turns on/off data randomization (default is false)
- allowMultipleImport - turns on/off multiple import; multiple import allows populating of data bank from more than one source (default is false)
- endless - turns on on/off data reuse after reaching the end of the source (default is true)
- isHeader - if true, the first line is considered to be a header
Preferably, use DataServerImportRequest.
Example
Data retrieval
Data are retrieved by sending HTTP GET request with getData parameter.
- getData - name of data bank (matches dataName parameter from Data population)
One record (usually one line from a CSV file) is returned for each request. It is recommended to use DataServerGetRequest or the HTTP Request component with et@sm - CSV Extractor.
http://localhost:8080/DataServer/data?getData=[DATA_NAME]
Note: In order to exclude the request to DataServer from test results, append [exclude] to the request name.
Header retrieval
Header is retrieved by sending HTTP GET request with getHeader parameter.
- getHeader - name of data bank (matches dataName parameter from Data population)
http://localhost:8080/DataServer/data?getHeader=[DATA_NAME]
Adding data
Data are added by sending HTTP GET/POST request with following parameters:
- addData - name of data bank
- value - new record to be added to data bank
Data can be added even during the test or added to a new data bank and export later as CSV.
http://localhost:8080/DataServer/data?addData=[DATA_NAME]&value=[VALUE]
Removing data
Data are removed by sending HTTP GET request with clearData parameter.
- clearData - name of data bank to be removed
http://localhost:8080/DataServer/data?clearData=[DATA_NAME]
Exporting data
Data bank is exported to a text file by sending HTTP GET request with exportData parameter.
- exportData - name of data bank to be exported
http://localhost:8080/DataServer/data?exportData=[DATA_NAME]
DataServer web interface
Simple web interface with limited operations is available at http://localhost:8080/DataServer/data.
Deployment architecture
Deployment architecture is captured in the monitor script.
TIP: You can use your PC as the Controller and remote machines as load generators. However, this requires to be in the same VLAN or use SSH tunneling.
One local generator
The most simple setup where the controller and one generator share the same machine. This is how SmartMeter operates when no monitor script is given. Performance is limited by the host machine.
Multiple local generators
Simple setup where the controller and generators are running on the same machine. This is not optimal because the controller and generators share the same resources thus possibly influencing each other and tainting test results. At least Java Virtual Machines are not shared.
One remote generator
The most simple remote setup. The controller and one generator run each on its own machine. Does not provide much power but at least separates the controller from generator. Typical use case is that the controller is a personal computer (notebook) and the generator runs on a powerful server.
Multiple remote generators (one server)
Suitable setup for medium performance. The controller is running on its own machine while load is generated from multiple instances of SmartMeter.io running on the same server.
Multiple remote generators (one per server)
Optimal SmartMeter.io setup. The controller is running on its own machine while load is generated from multiple servers. Servers can be located in various geographic locations. It is possible to assign specified virtual users to particular specified generators.
Multiple remote generators
Optimal SmartMeter.io setup. The controller is running on its own machine while load is generated from multiple servers. One server should be able to host multiple instances of generators. How many depends on its hardware configuration.
Features
List of SmartMeter.io unique features.
Acceptance criteria (SLAs)
Since 1.3.0
For documentation see et@sm - Acceptance Criterion.
For examples see Evaluate tests automatically with acceptance criteria blog post.
System resources monitoring
It is a good practice to monitor system resources (CPU, memory, Disks I/O, ..) on all affected machines (system under test, load generators, Controller) while running a performance test. Setup is a 2-step procedure:
1) Deploy PerfMon Server Agent (Controller and load generators already starts Server Agent by default)
2) Set up et@sm - PerfMon Metrics Collector according to PerfMon official documentation
System resources monitoring graphs will be automatically included in the test report.
Recording log
Recording log helps with finding sources of dynamic parameters. It shows full detail of HTTP communication (request/response headers and bodies) from the recording time. Standard use case is to find a response which contains the dynamic parameter.
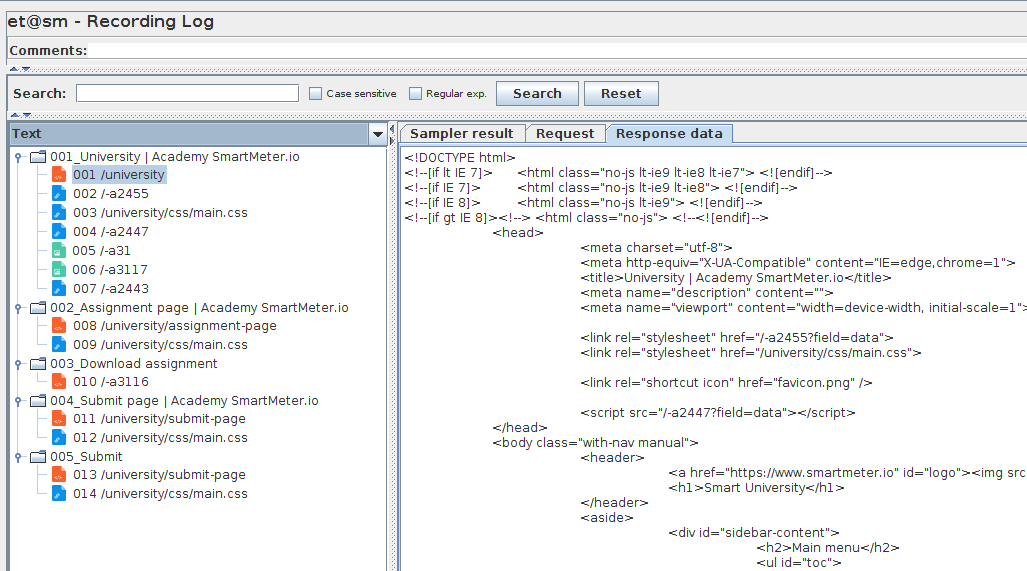
Recording log is based on View Results Tree listener but it has a few modifications:
- Automatically loads the recording file (recording file .jtl is expected in the same folder as the test script file .jmx)
- For easier navigation colors requests/responses by type. Documents and XHR are orange, other texts are blue and pictures are green.
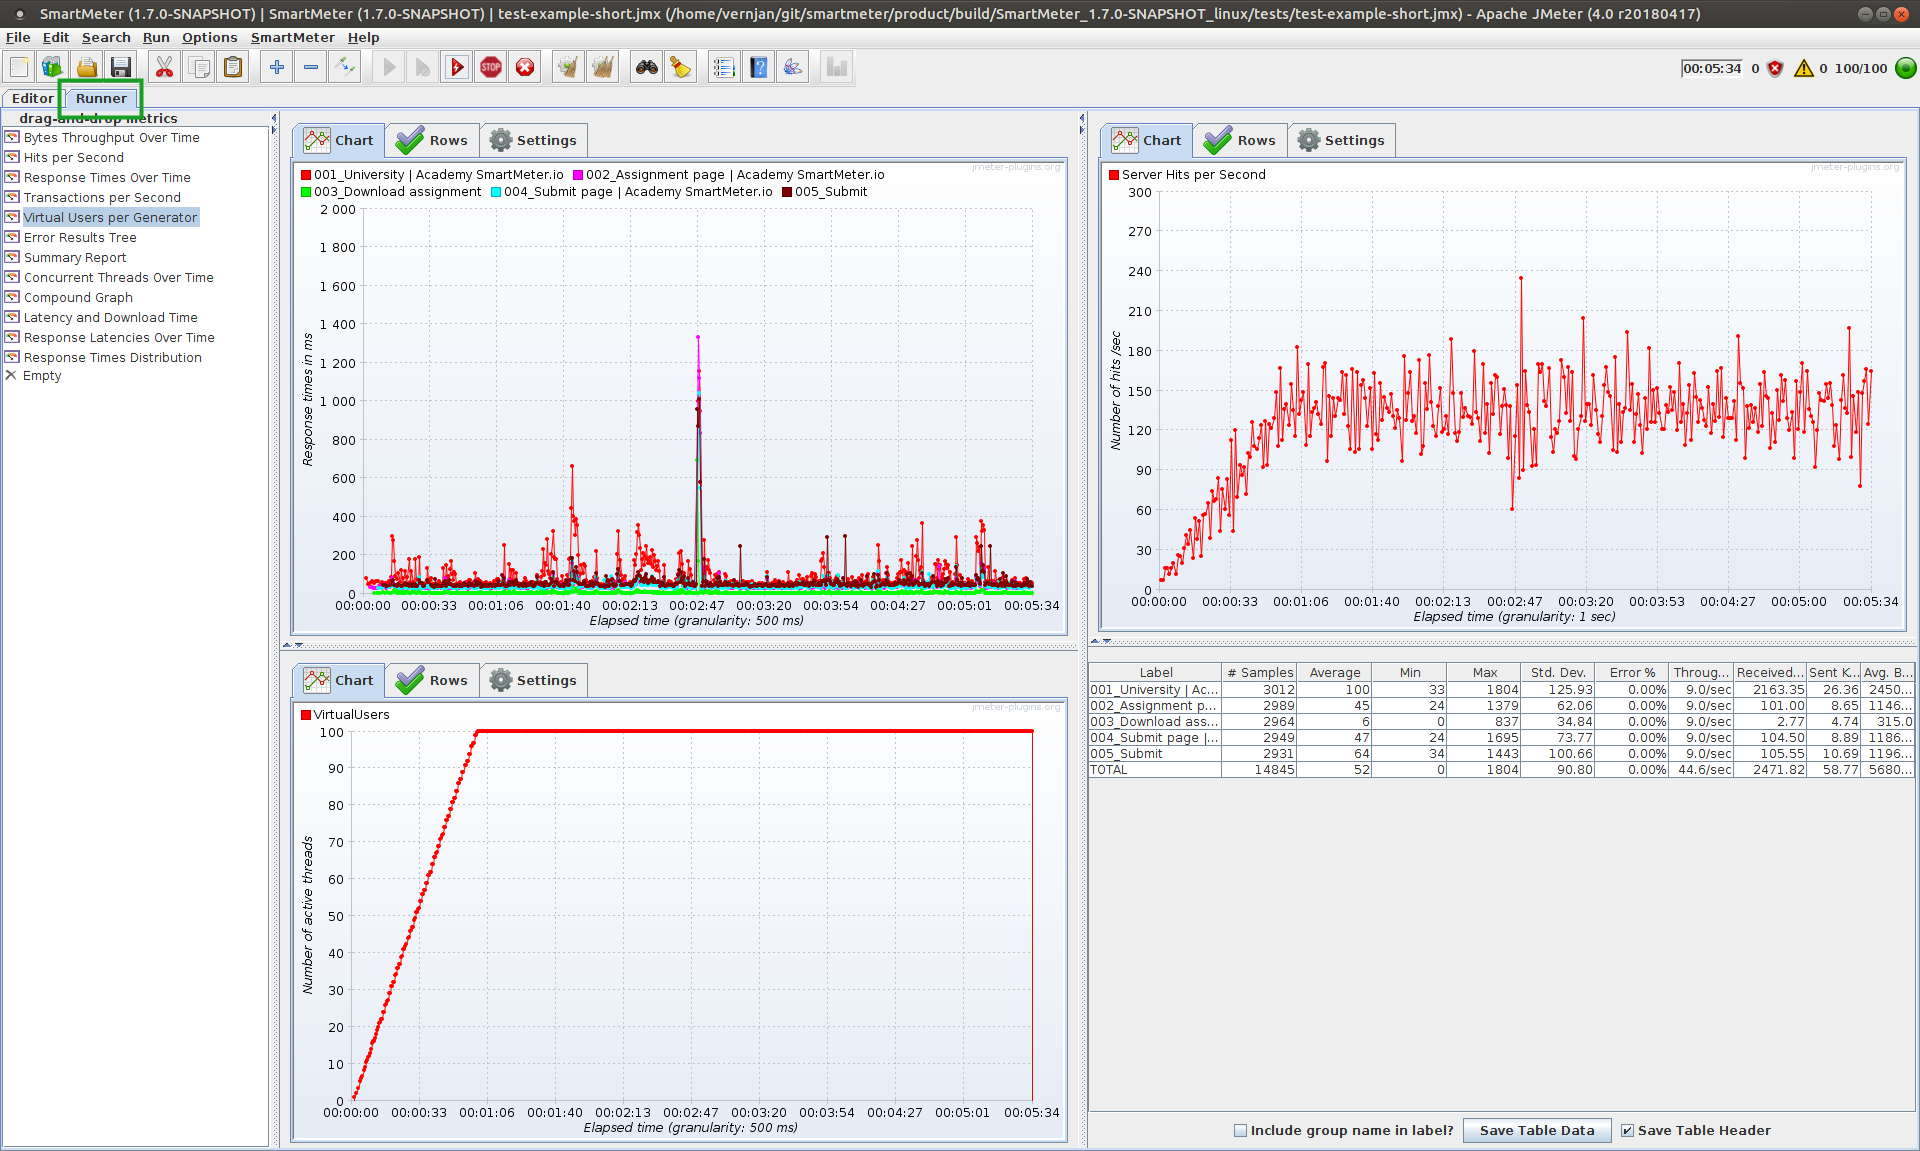
Runner tab
Use the Runner tab for real-time data. No need to add individual listeners to your test plan.
Exclude samplers from report
If the name of a sampler contains [exclude] string, the sampler is excluded from the test report. Handy for auxiliary samplers.
Static resources
Both SmartMeter.io recorders detect static resources (images, style sheets, scripts, ..) and save them as a iterable list of URLs, not fully-fledged HTTP requests.
This special treatment offers following advantages:
- clarity - only few meaningful requests remain,
- performance boost - reusing single HTTP request for a bunch of static resources saves runtime memory,
- quickly enable/disable all static resources - open SmartMeter menu, select Test > Enable/Disable static resources
Undo/Redo
SmartMeter support undo/redo.
- Undo - undo the last change (CTRL + z)
- Redo - restore the last undone change (CTRL + y)
Error Results Tree
Error results tree shows failed sampler results including the full detail - assertion error and request and response data. It is available even in distributed mode. The trick is to send the failed samplers only so there is very little performance overhead. Error results tree shows automatically when the first error occurs.
Detached chart windows
Metrics can also be viewed in detached windows. This way you can fully customize your workspace, even on multiple monitors. Window positions are saved between test runs.
Smart Proxy Recorder
Smart proxy recorder extends the capabilities of standard HTTP test script recorder. It starts another daemon which accepts controlling commands (HTTP requests) and thus allowing to manage the whole recording process remotely. It is capable of adding new thread groups, inserting pauses between transactions, exporting the test to JMX file and much more. The idea behind is to easily allow fully automatic transformation of functional tests (for example Selenium tests) to load tests. All you need to do is enrich your functional tests with few controlling requests. Another use-case is to automatically re-record your test before running to always have up-to-date static resources.
The best scenario goes like this:
- Enrich your functional tests with controlling commands
- Start Smart proxy recorder
- Setup proxy through Smart proxy recorder
- Run the enriched functional tests and let them automatically transform into load tests. The output is a bunch of JMX test files.
- Run the load tests with your CI tool.
- et@sm - Smart Proxy Recorder - SmartMeter.io for transformation functional test into load test
- Thread Groups
- Default - if user doesn't create its own Thread Group all transactions go under this component
- UserDefined - created by user on command start subset (see below)
- Start/Stop Smart Proxy Recorder - start or stop recording daemons
- Capture realtime between transactions - automatically put ThinkTime component between transactions with sleep length according to a real-time waiting
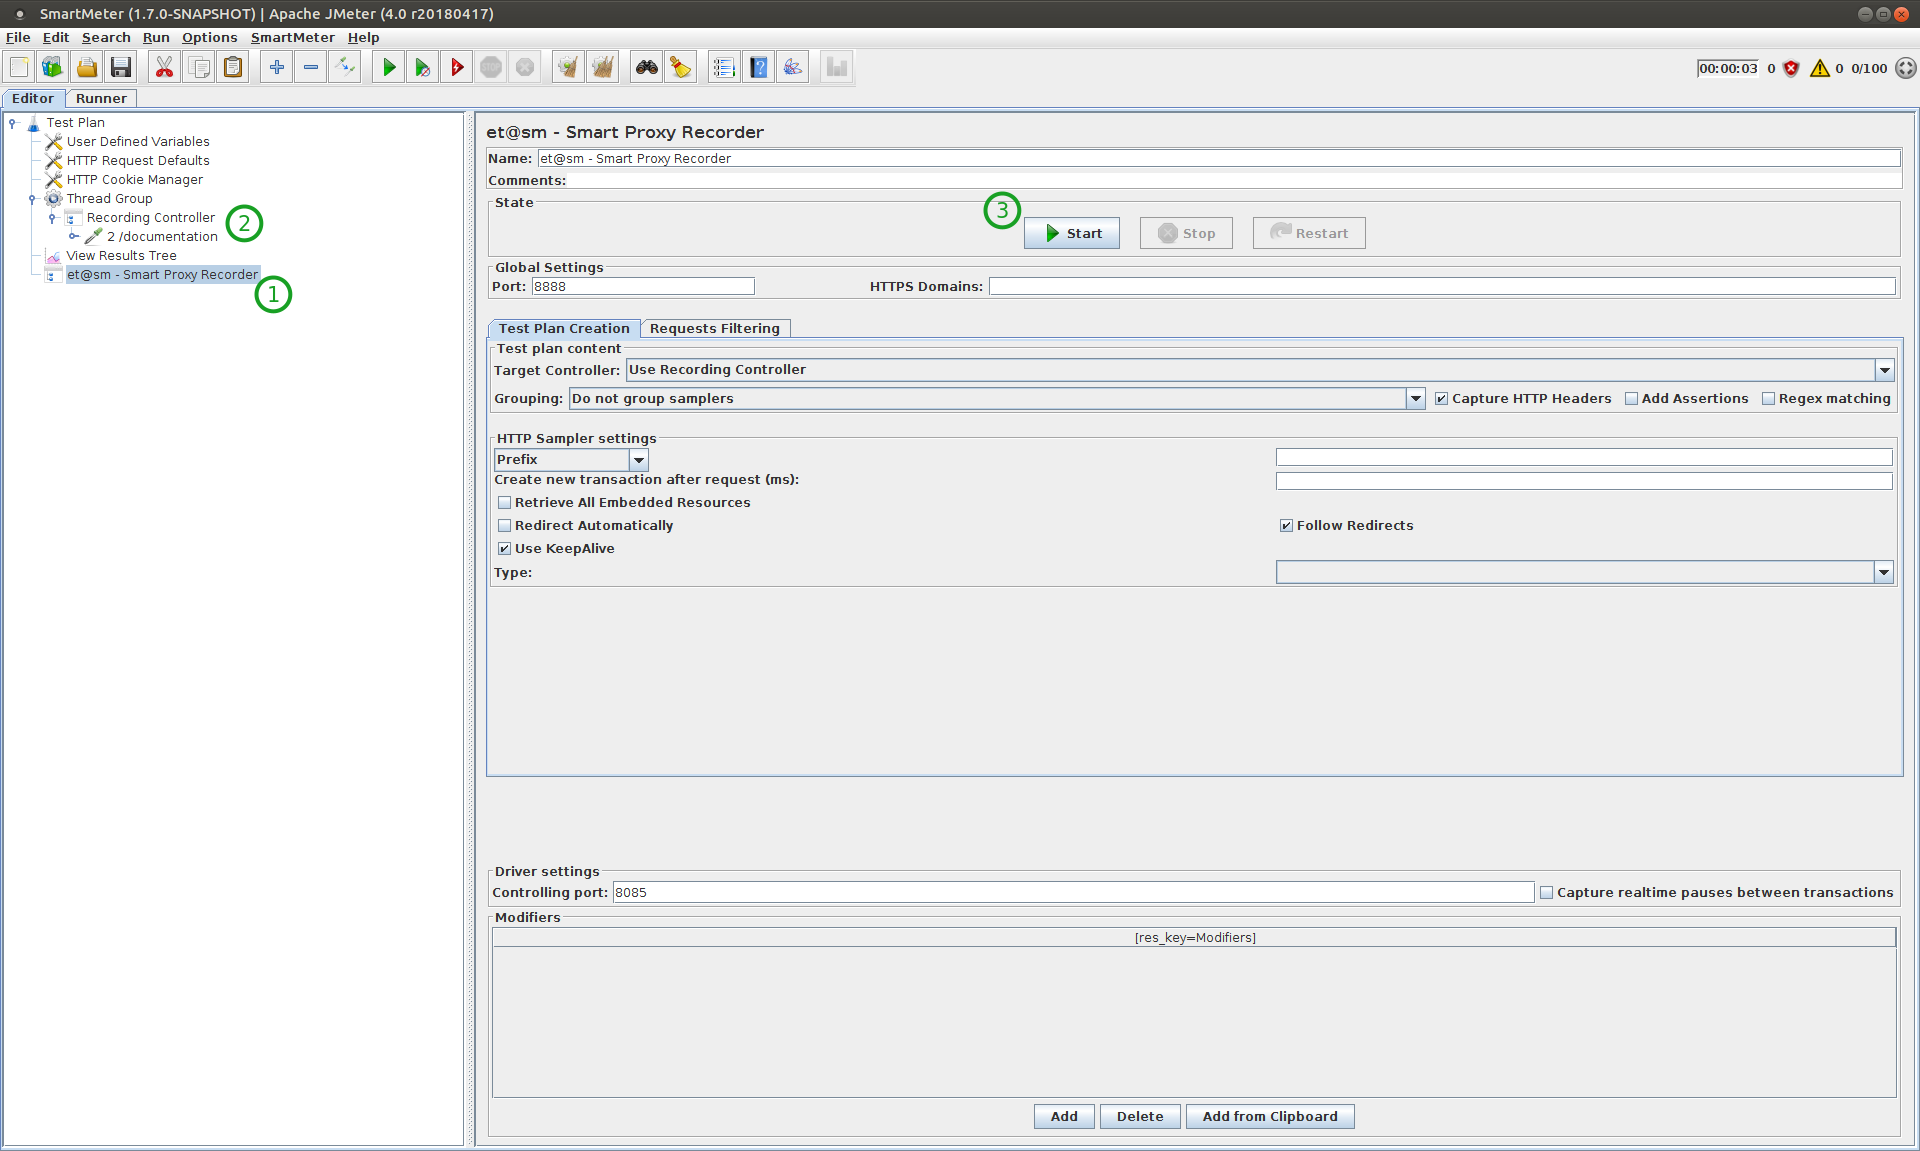
Bootstrap
Starting Smart proxy recorder is very easy - just open the smart-proxy-recorder.jmx file in folder "tests", expand the Workbench node (1) and click on Start button (3) in et@sm - Smart Proxy Recorder component. The recording daemon runs on 8080 (default) and the controlling daemon on 8085 (default) port. Do not confuse them! Smart Proxy Recorder component is based on standard JMeter HTTP Test script recorder component. See the official documentation for more details.
Next step is proxy configuration in your browser, check out this tutorial on page 4 and also this guide for setting up the certificates.
Now you can start recording! First we recommend to create subtest so your transactions will not end up in "Default" (2). If you have to activate some CSV file, now is the right time. Maybe add one or two Replacers too? Your transactions can be recorded directly through browser that has the right proxy configuration. Below you can find more commands to control Smart proxy recorder.
Since 1.1.0, Smart proxy recorder supports automatic correlations.
Commands API
Smart proxy recorder exposes a simple REST API on its own configurable port (default is 8085). Do not forget to encode illegal characters if using any.
Status check
Simple command which always returns "OK" and do nothing else. Serves to check that Smart Proxy Recorder is up and running.
../proxy-driver?command=status
Start subtest
Inserts a new thread group which immediately becomes a target for newly captured requests. This command can be called repeatedly.
../proxy-driver?command=start-subtest&name=[NAME]&users=[USERS]&duration=[DURATION]&rampup=[RAMPUP]
- NAME – name of the subtest
- USERS – number of users (integer)
- DURATION – test duration in seconds (integer)
- RAMPUP - ramp up time of users in seconds (integer)
Example
../proxy-driver?command=start-subtest&name=MySubset&users=5&duration=20
Finish subtest
Finishes the subtest. Target for newly captured requests is changed to the Thread Group "Default" (under Recording Controller) and the internal state of Recorder is reseted. Inserts the pause if capture realtime between transactions option is on.
../proxy-driver?command=finish-subtest
Change recording target
Changes the target of recording to a requested element (thread group).
../proxy-driver?command=set-target&name=[NAME]
NAME – name of the new target element
Datasource activation
Inserts HTTP request (including CSV extractor) to DataServer into the active subtest. This request retrieves dynamic data from DataServer and exposes them as variables. Use in combination with replacers.
../proxy-driver?command=activate-datasource&datasource=[DATASOURCE]&delimiter=[DELIMITER]&variables=[VAR1,VAR2,..]&domain=[DOMAIN]&port=[PORT]
- DATASOURCE – name of the data source
- DELIMITER - delimiter used within the data source (default is ;)
- VAR1,VAR2 – List of variable names (order matches the order of values on the one line in CSV data source). If the list is empty, variable names are retrieved from the first line (header) of data source but only if the data source was imported with parameter isHeader=true.
- DOMAIN – domain name where the DataServer runs (localhost is the default)
- PORT - port where the DataServer runs (8080 is the default)
CSV file activation
Inserts CSV Data Set Config into the active subtest. This allow to obtain dynamic data from external CSV files.
../proxy-driver?command=activate-csv&filename=[FILENAME]&delimiter=[DELIMITER]&variables=[VAR1,VAR2,..]
- FILENAME – name of the CSV file. Put the file into folder "tests". Read more in the offical JMeter documentation.
- DELIMITER – delimiter used within the file (optional, if not specified system will use ";")
- VAR1,VAR2 – variable list. Similar to first line in CSV file which give names to variables (optional, if not specified first line of CSV file is taken)
Example
../proxy-driver?command=activate-csv&filename=MyCSV_file.csv&delimiter=,&variables=variable1,variable2
Adding replacers
Adds a replacer into memory. From now replacers are applied on recorded requests until they are explicitly removed or the subtest is finished (see Finish subtest command). Replacers applied on a request will stick with it forever.
../proxy-driver?command=add-replacers&replacer=[KEY1]~[PLACEHOLDER1]&replacer=[KEY2]~[PLACEHOLDER2]
- KEY - key which values are dynamic and must be replaced with placeholders
- PLACEHOLDER - name of the placeholder
Example
../proxy-driver?command=add-replacers&replacer=login~username
After adding this replacer, requests containing key-value pair for example login=john will become login=${username}. Placeholders are expected to be filled from DataServer or CSV file.
Removing replacers
Removes the replacer(s) from memory. If no replacer is given, all replacers will be removed. From now replacer(s) will not affect future transactions. Already recorded transactions will still contain their replacers though.
../proxy-driver?command=remove-replacers&replacer=[KEY1]&replacer=[KEY2]&..
Example
../proxy-driver?command=remove-replacers&replacer=login~username
After removing this replacer, requests containing key-value pair for example login=john will stay the same.
Add variable
Inserts a new variable (for example ${myToken}) and sets its value. The variable will be defined at the start of the current thread group. It can be used to generate dynamic values (for example to generate a random name). The value of the variable is specific for each thread and is reassigned at the beginning of each walkthrough. More variables can be defined at once.
../proxydriver?command=addvariable&variable=[NAME]~[VALUE]&variable=[NAME2]~[VALUE2]
- NAME – variable name (do not wrap inside ${})
- VALUE – variable value, usually a function
Example
Generate random name (6 alphabet characters)
variable=firstname~${__RandomString(6,abcdefghijklmnoprstuvxyz)}
Watchout, you have to encode the value!
variable=firstname~%24%7B__RandomString%286%2Cabcdefghijklmnoprstuvxyz%29%7D
Insert pause
Insert a pause (ThinkTime component) on the last position in the active subtest.
../proxy-driver?command=insert-pause&duration=[DURATION]
- DURATION – duration in ms (optional, if not specified component will wait for 5,000 ms)
Export test
Export the test as a fully runnable JMX file. Tests are exported to the tests folder.
../proxy-driver?command=export-test&testName=[TEST_NAME]
- TEST_NAME – name of the exported test (optional, if not specified test will be named recorder-test-[TIMESTAMP].jmx)
Clear recording
Clears all captured requests and resets the internal state of the recorder.
../proxy-driver?command=clear-recording
Run test
Starts the recorded or an already existing test. If the name of the test is not provided, the actual test plan is exported to the temporary file and run.
../proxy-driver?command=run-test&monitorName=[MONITOR_NAME]&testName=[TEST_NAME]&gui=[GUI]
- MONITOR_NAME - name of the monitor script to be run in distributed mode, script is expected to be located in the tests/monitors folder
- TEST_NAME - name of the test to run, test is expected to be located in the tests folder
- GUI - if false, the test will be run in NON-GUI mode (optional, if not specified will run in GUI mode)
Integrations
Integrations with 3rd party software.
Continuous Integration
SmartMeter.io fits very well into a continuous integration process. It can be operated using command line interface. A huge benefit is support for definition of acceptance criteria (or SLAs) which allow to automatically decide whether the test passed or failed. There is no dependency on particular CI tool (no plugin is required).
See our blogpost MAKING PERFORMANCE TESTING PART OF YOUR CONTINUOUS INTEGRATION ENVIRONMENT.
General tips
- Add test script(s) to your project's VCS.
- Use Acceptance criteria to automatically evaluate test results
- Schedule a job which will run the performance test repeatedly.
- Install a web server (Apache HTTP Server, nginx, ..) and point it to the reports folder. This way you can immediately browse the reports.
- Send a notification (email, Slack, ..) when the job is finished.
- Add
-Jetn_report_skip_log_archiving=trueto exclude JTL files from report and make it much smaller.
Useful commands:
Run Non-GUI test
./SmartMeter.sh runTestNonGui path/to/your/test.jmx
Run Non-GUI distributed test
./SmartMeter.sh runDistTestNonGui path/to/your/monitor.jmx path/to/your/test.jmx
Useful properties:
Path where to save test results
-Jetn_results_path=PATH/TO/YOUR/FOLDER
Path where to save test reports
-Jetn_reports_path=PATH/TO/YOUR/FOLDER
Name of the report folder
-Jetn_report_name=YOUR_NAME // for example the current build number
And others from Folder layout configuration.
Dynamic properties:
Take advantage of JMeter P function, for example append -Jsm.virtualUsers=1000 to your SmartMeter running command and then read the property value in your test script using ${__P(sm.virtualUsers, 500)}
Jenkins
Together with SmartMeter we recommend to install Jenkins slave.
Assume SmartMeter is installed in /home/etndevel/SmartMeter_MASTER and that TEST_SCRIPT is a String parameter with path relative from SmartMeter_MASTER/tests or with an absolute path.
Jenkins starts a Non-GUI test running the test script defined in $TEST_SCRIPT. The report is saved to /home/etndevel/reports folder and the report's name is report-$BUILD_NUMBER.
The report is zipped to Jenkins workspace and then archived which makes it easily accessible at any time.
TIPS
- Use Project Description Setter Plugin to set build description (test script name, link to report, ..)
- Use Build User Vars Plugin to know who ran the job
Bamboo
Example of integration with Bamboo.
Run performance test
Add SmartMeter executable
Archive report
View test report
TeamCity
See our blogpost LEARN HOW TO SETUP TEAMCITY FOR LOAD TESTING.
Selenium
SmartMeter measures response times from backend only. To obtain full render page times, combine you load test scenario with a Selenium test. Both tools can operate quite easily together. Read official
Web Driver Tutorial first.
Note: For distributed tests, we recommend to add the Selenium test to your monitor script.
See et@sm - Web Driver Sampler to get some extra features.
Compatibility issues
It is critical to use compatible versions of Selenium driver and browser.
The Web Driver plugin 2.3 uses internally Selenium 2.52.0 which requires Firefox 46 or older.
Chrome drive is not embedded in the plugin and must be provided explicitly. Download official Google Chrome plugins here.
Maven plugin
See https://github.com/etnetera/smartmeter-maven-plugin
Vaadin
Please read this article on our blog.
Warning: Vaadin tests tend to be quite complicated and therefore it is recommended to run tests in distributed mode (let's say 300-500+ VUs) or at least increase the JVM heap size.
Regular expression explanation
\\"(\d+)\\":\{[^}]*\\"id\\":\\"LABEL.domestic.initial.priorityPayment\\"
Regex matches in context of escaped JSON, therefore all the slashes. Let's hide them for a while.
"(\d+)":\{[^}]*"id":"LABEL.domestic.initial.priorityPayment"
Looks simpler. The regex matches a number in double quotes which is followed by :{ and then a sequence of any characters except the } followed by the "id" attribute with the given value.
Correlations overview
|
Name |
Description |
Occurrs in |
|
Security key (CSRF token) |
Unique for each user session. The value is stable. Each portlet has its own security key. |
Request body |
|
uiId |
Starts from 1 and is incremented everytime the whole UI is freshly rendered (page refresh, visiting the same again or opening the page in a new tab). |
Query string |
|
Sync ID |
Starts from 1 and is incremented with each new response from the server. Resets after refresh. |
Request body |
|
Connector ID |
Each UI component has its own unstable connector id. This connector id must be parsed from a previous response otherwise the test script might break at anytime. Unfortunately, there is no easy way how to parse it unless having a unique identificator for each component. Usually, this is not the case and it is necessary to rely on secondary identificators such as captions or CSS classes in combination with the order of occurrence. |
Request body (multiple occurrences) |
|
Client ID |
Since Vaadin 8. Starts from 1 and is incremented with each new response from the server. Resets after refresh. |
Request body |
APM Dynatrace
To quickly find a source of an error in a request, make a detailed analysis of test results or to compare results of each run, an integration with Compuware dynaTrace system can be used.
See et@sm - DynaTrace Header to know how integrate.
Finding request details
Every request sent to the server where a dynaTrace agent is deployed returns the X-dynaTrace header among response headers. Using the value in this header a PurePath can be searched, which displays detailed tree structure showing the path of requests throughout the system.
A detailed procedure is shown in the following figure.
Viewing test details
Integration with the dynaTrace system lets you search and merge requests according to test name, user group, user id or request type. For this function the "Tagged Web Requests" dashlet of the Dynatrace system can be used.
A detailed information about the propagation of the test information is shown in the following figure.
JMeter plugins
SmartMeter.io includes by default some of JMeter plugins.
- Plugins Manager
- Custom Thread Groups
- Custom JMeter Functions
- Command-Line Graph Plotting Tool
- 3 Basic Graphs - Average Response Time, Active Threads, Successful/Failed Transactions
- 5 Additional Graphs - Response Codes, Bytes Throughput, Connect Times, Latency, Hits/s
- Distribution/Percentile Graphs
- Selenium/WebDriver Support
- PerfMon (Servers Performance Monitoring)
- Synthesis Report
- Filter Results Tool
- JSON Plugins
Miscellaneous
This chapter reviews SmartMeter.io in more detail. Some more advanced functionalities are covered here.
CLI
SmartMeter.io might be started from the command line. This is particularly useful in case of including performance tests in your Continuous integration process, or in case of using timed autorun tests.
NOTE: SmartMeter scripts from the bin folder contains the cd directive. This can cause troubles if there are path sensitive commands called after those scripts (for example as a part of your CI/CD pipeline).
To execute a command on Linux/OS X
./SmartMeter.sh COMMAND [ARGUMENTS]
To execute a command on Windows
SmartMeter.bat COMMAND [ARGUMENTS]
- runTest [test path] - Starts SmartMeter.io and runs a test in GUI.
- [test path] - path to test script with base in tests path (by default the tests folder)
- runDistTest [monitor path] [test path] - Starts SmartMeter.io and runs a distributed test in GUI.
- [monitor path] - path to monitor script with base in monitors path (by default the tests/monitors folder)
- [test path] - path to test script with base in tests path (by default the tests folder)
- runTestNonGui [test path] - Runs a test in Non-Gui mode. Test progress is printed on standard output. Make sure that the et@sm - Controller Summary Report is included in your test plan! Otherwise you will not be able to get the report.
- [test path] - path to test script with base in tests path (by default the tests folder)
- runDistTestNonGui [monitor path] [test path] - Runs a distributed test in Non-GUI mode. Test progress is printed on standard output. Make sure that the et@sm - Controller Summary Report is included in your test plan! Otherwise you will not be able to get the report.
- [monitor path] - path to monitor script with base in monitors path (by default the tests/monitors folder)
- [test path] - path to test script with base in tests path (by default the tests folder)
- runGenerator [gid] - Starts SmartMeter.io generator. RMI server hostname is auto-detected if not specified explicitly by adding -Djava.rmi.server.hostname parameter. The auto-detection mechanism is not 100 % successful depending on the underlying OS.
- [gid] - generator ID, useful for more instances on the same server to distinguish log files
- [--sync] - generator launcher will wait until generator terminates (i.e., run in the foreground)
- runLocalGenerator [gid] - Starts SmartMeter.io local generator. RMI server hostname is set to 127.0.0.1.
- [gid] - generator ID, useful for more instances on the same server to distinguish log files
- runProxyRecorder [template file] - Starts Smart Proxy Recorder with a custom recording template.
- [template file] - Either a relative path from the tests folder or an absolute path to a recording template file (.jmx).
- runEditor [test path] - Starts SmartMeter.io editor and opens the test.
- [test path] - path to test script with base in tests path (by default the tests folder)
Test and monitor path resolution
- Absolute paths are passed on unchanged.
- Relative paths are resolved from the given base.
- If resolution from base fails (file does not exist), path is resolved from SmartMeter root folder. This is convenient for running tests from CLI because it allows to utilize path auto-completion.
Reports
Since 1.4.0
Use script generateReport.sh (.bat) in bin folder to generate report from a log file.
- [log file/folder] - relative path from SmartMeter root folder or an absolute path to a log file (.jtl) or a folder with log files (all log files will be processed in one batch)
- [test script file] - optional, relative path from SmartMeter root folder or an absolute path to a test script file (.jmx); if present SmartMeter.io will evaluate acceptance criteria and add results to trend analysis
Example
bin/generateReport.sh results/20170411-102018-report.jtl tests/test.jmx
Extra Parameters
Since 1.3.0
Besides mandatory parameters, all commands also accepts JMeter properties and SmartMeter properties. Use standard -J prefix. For example, to run a test and save report to a custom folder:
./SmartMeter.sh runTestNonGui my-test.jmx -Jetn_reports_path=/opt/perf/reports
| Parameter key | Alias | Description | Default Value |
|---|---|---|---|
| etn_create_report=true | --report | Create report after test | TRUE in Non-GUI, FALSE in GUI |
| etn_create_report=false | --no-report | Do not create report after test | TRUE in Non-GUI, FALSE in GUI |
| etn_result_file_name=STRING | Name of the result (log) file, pattern is [etn_result_file_name]-report | [TIMESTAMP]-report | |
| etn_report_name=STRING | Name of the report, pattern is report-[etn_report_name]-[TEST-SCRIPT-NAME] | report-[TIMESTAMP]-[TEST-SCRIPT-NAME] |
Update to newer version
SmartMeter automatically detects new updates when Welcome screen is started.
Click OK and wait until the download completes. SmartMeter will restart itself and start in the update mode.
Click Update and wait until the update completes. Start SmartMeter again.
NOTE: Updating SmartMeter to newer version will not affect your data (test scripts, results, reports, ..).
Tips & Tricks
- In case you want to keep the older version, just download and unpack the new version and copy your license file.
- In case you want to update offline, download the update, place it into SmartMeter root folder and start SmartMeter.
- In case you want to update in Non-GUI mode, run:
java -jar [UPDATE-FILE-NAME].jar
License installation without GUI
To install the license file in headless environment, just copy it to SmartMeter custom folder. The license file name must match license.bin. License is required on Controller only, no need to install it on load generators.
License info
To find out details about your license open SmartMeter.io Editor and click License info under SmartMeter menu.
Configurator
SmartMeter.io configuration is saved to custom/smartmeter.properties file. Either edit the file directly or use Configurator, a graphical interface. To open Configurator, click on Welcome screen.
Global configuration
Global configuration enables to share single configuration among many installations of SmartMeter. SmartMeter can be configured to use shared tests, data, libraries and custom properties. The advantage is easy maintenance and version updating. Local configuration (custom/smartmeter.properties) has precedence over global configuration.
SmartMeter searches for global configuration in the following places:
../smartmeter.properties

USER.HOME/.smartmeter

/etc/smartmeter
Folder layout configuration
| Key | Description | Default |
|---|---|---|
etn_licence_file
|
Path to licence file |
custom/licence.bin
|
etn_tests_path
|
Path to tests folder |
tests
|
etn_results_path
|
Path to results folder |
results
|
etn_reports_path
|
Path to reports folder |
reports
|
search_paths
|
Path to libraries (added to classpath) |
custom;custom/libs
|
Files organization
The SmartMeter folder contains the following structure of folders and files.
- backup - backups of previous versions in case of update
- bin - auxiliary executable scripts
- custom
- libs - default place for extra libraries (.jar)
- licence.bin - license file
- smartmeter.properties - configuration file
- doc - online and offline documentation
- logs - application logs
- programs - 3rd party programs
- reports - default location for test reports
- results - default location for test results (log files)
- tests - default location for test scripts including some examples
- monitors - monitor scripts
- utils - temporary auxiliary files
Recovery from crashed test
It might happen that the running test crashes. It can be due to running out of memory, accidental restart, application error and so on. In a such scenario, there is still a chance to recover test results. Follow these steps:
- We recommend to do a backup of temporary result files. By default they are located in system's temp folder and their names starts with SmartMeterTemporaryResults. We also recommend to backup log files located in the logs folder for later analysis.
- Kill all running instances of SmartMeter.io on Controller and load generators.
- Select the result-collector.jmx test script, do not change the monitor script.
- Start the test and wait until the log collection completes. If something go wrong, recover the temporary results and try again.
Shutdown hook
Shutdown hook executes an arbitrary script after SmartMeter.io exits. Use cases are to move logs on other disk, start another test and so on.
Shutdown hook is configured in Configurator (tab test), namely by the following properties:
- Shutdown after test (etn_shutdown_after_test) - Turns on/off automatic shutdown of SmartMeter.io after test (including reports).
- Shutdown hook script (etn_shutdown_hook) - This command (script) will be executed after completion of the test when SmartMeter.io exits.
- Shutdown hook workdir (etn_shutdown_hook_dir) - Working directory for etn_shutdown_hook.
Example:
etn_shutdown_after_test = true
etn_shutdown_hook = sh my-hook.sh
etn_shutdown_hook_dir =
Stop or kill running SmartMeter
Stop or kill running SmartMeter from outside. Useful for Non-Gui mode and CI tools (for example Jenkins). Usage is simple, just create an empty file with the following name in the utils folder (or use the scripts in bin folder).
- File kill immediately terminates SmartMeter.io. It is useful for terminating Smart Proxy Recorder from CI. It is not recommended to use while a test is running unless you do not care about the results.
- File softkill first stops test and then terminates SmartMeter.io. It is useful for interrupting a test in Non-Gui mode or for interrupting a test from CI tool. Report generation is skipped but can be done afterwards.
Telemetry overview
If consent is given, we collect the following data:
- SmartMeter was started
- Recorder was started
- Test was started including SmartMeter version
- Test ended including test duration and maximum number of virtual users
You can revoke your consent at any time in Configurator (tab common).
This help us to learn how SmartMeter is used.
Components
SmartMeter.io includes original JMeter components documentation, extra components from JMeter plugins, and its own components prefixed with et@sm (etnetera@smartmeter).
Thread Groups
et@sm - Distributed Concurrency Thread Group
This thread group is based on bzm - Concurrency Thread Group and adds support for automatic distribution of virtual users between load generators. For example, if set to 5 000 VUs, and having 5 load generators, each generator will run 1 000 VUs by default. The next feature is the "Run only on generators" property, which allow us to define selective generators, which will run this thread group. Good for simulating load from various geological locations or for testing both from the cloud and own infrastructure at one time.
Test will not end until all virtual users finish their journey.
- Run only on generators - In some scenarios it is necessary to have more control over load distribution. For example to distribute the load unequally from different locations.
Example
- Need to simulate 1000 VUs
- 3 generators available - 2 located somewhere in Cloud (10.241.102.30 and 10.241.102.31) and 1 located in LAN of the tested system (161.12.37.58).
- Simulate 10 % of the load from LAN and 90 % from the Cloud
Solution
Use 2 Distributed Concurrency Thread Groups (let's name them Cloud Users and LAN Users).
Set the Cloud Users Run only on generators to 10.241.102.30, 10.241.102.31 and number of VUs to 900.
Accordingly, set the LAN Users Run only on generators to 161.12.37.58 and number of VUs to 100.
et@sm - Distributed Lazy Stepping Thread Group
This thread group is very similar to et@sm - Distributed Concurrency Thread Group, one of key difference is that virtual users do not finish the entire journey once the test ends.
Logic controllers
et@sm - Static Resources Transaction Controller
Placeholder for static resources. Enables quick enable/disable of all static resources.
Timers
et@sm - ThinkTime
Unlike standard JMeter timers, ThinkTime stops the thread at the precise position in the test plan tree where it is placed. This makes possible to place it between transaction controllers where it is visible at first glance.
It also allows waiting period randomization (uniformly distributed) by setting min and max boundary in percents.
Note: ThinkTime is based on a sampler, not timer, therefore it cannot be placed inside another sampler!
Pre Processors
et@sm - DynaTrace Header
Integration with DynaTrace APM - this pre processor adds "x-dynaTrace" header to each HTTP request in scope.
Header consists of:
- TE - Test Name is the name of the entire load test. It uniquely identifies a test run.
- SN - Script Name. This groups a set of requests that make up a multi-step transaction, for example making an online purchase.
- NA - Transaction Name. Metrics for requests with the same name will be aggregated (required).
- VU - The unique number of the Virtual User that sends the request.
- ID - The unique request ID (serial number). This string should be unique for one web request or a set of web requests that together make up a step/transaction execution.
Example
x-dynaTrace: VU=1-1;ID=1-1.48780505499371;TE=test.jmx_1464006951111;SN=VirtualUsers;NA=www.smartmeter.io/
Post Processors
et@sm - Boundary Body Extractor
Deprecated in 1.7.0 (JMeter 4.0 finally brings its own Boundary extractor)
Designed for easy and fast extraction of dynamic values which can be found using the left and right boundaries (e.g. token="DYNAMIC-VALUE").
- Extract from - Extract from HTTP response body or headers.
- Occurrence - Look for the first, last or random occurrence.
- Reference Name - Name of a variable which will hold the extracted value.
- Left Boundary - Left boundary of the extracted value. Avoid using special characters such as end of line (\n).
- Right Boundary - Right boundary of the extracted value. Avoid using special characters such as end of line (\n).
- Search Limit - The number of occurrence we want to extract. If the value is more than 1, all previous occurrences are stored to variables REFERENCE_NAME_1..x (for example token_1, token_2 and so on). The REFERENCE_NAME will hold the value according the "Occurrence" setting (First/Last/Random).
- Default Value (f! = Fail if not found) - Default value used if there is no extracted value. If set to "f!" and no value is extracted, the parent sampler is labeled as erroneous.
et@sm - CSV Extractor
Used for quick and simple obtaining of multiple values from a row with a uniform separator. Ideal for saving values from DataServer, for instance.
- Variables [example1; Example2] - names of variables for extracted values from CSV record.
- Delimiter [;] - separator (the default value is a semicolon)
et@sm - Header Value Extractor
Extracts headers values by headers names.
- Variable - name of the JMeter variable which will hold the extracted value
- Header name - header name
et@sm - Links Extractor
Extracts links from HTML and saves them to indexed variable.
Assertions
et@sm - Range Response Assertion
This is a widespread element for verifying whether a returned message contains an expected string. Functions Range Text Response and Fast Text Response are added. In both cases, a Contains pattern is always used - i.e. whether the request contains the demanded string. The main significance of these features is the speed in which it can verify the existence of the searched text. Used algorithm is much faster than default options, and thus there is no generators overloading, that is not just their processors but memory usage as well. Other functions are unchanged, so they work in the same way as in the component Response Assertion.
Range Text Response searches only in the bottom of the page. The size of the search can be set with the etn_range_assert_limit parameter in the Configurator. The default value is 72 [byte].
- Response Field to Test - a search algorithm used
- Patterns to Test - the text to be searched. For Range Text Response and Fast Text Response functions always only the first string is searched for.
Config Elements
et@sm - Acceptance Criterion
Acceptance criteria enables auto-evaluation of test results. The evaluation is not real-time, it is performed at the end of test. If any of the acceptance criteria fail, then the whole test run is considered a failure and exit code 2 is returned. Most of the Continuous integration tools will interpret this as a build failure.
The location of a criterion component in the test plan does not matter.
Source
The source of data to be evaluated. Imagine as a line of samples with a timestamp and metric value. For example for response times:
[1477310129 - 1788 ms; 1477310987 - 1566 ms; 1477311229 - 1669 ms; ...]
- Source
- Samplers - Evaluate upon each sampler result, transactions are ignored.
- Transactions - Evaluate upon each transaction, samples are ignored.
- System resources - Evaluate upon et@sm - PerfMon Metrics Collector samples.
- Metric
- Samplers & Transactions
- Errors - Failed sample is represented as 1, passed sample is represented as 0
- Response time - Response time in milliseconds
- Hits - No value
- System resources
- CPU, Memory, Disks I/O, Network I/O, .. - See PerfMonMetrics
- Samplers & Transactions
- Listener
- For System resources, one of et@sm - Synchronized PerfMon Metrics Collector located in the test script
Filter
Samples not accepted by the filter are excluded.
- All - Filter is off. All samples are accepted.
- Equals - Sample name must be equal to the given value.
- Matches (regex) - Sample name must match the given regular expression.
- Not matches (regex) - Sample name must not match the given regular expression.
Aggregation
Samples are first put into groups (by name, by timestamp or by both). The the aggregation function is applied on each group.
- Group samples by label? - If checked, samples are grouped according their names.
- Group samples by time frames (in seconds) - If set, samples are grouped into slices of the given size according their timestamps. If not set, all samples are put into one slice (from test start to test end). Using slicing will make sure that even short-term deviations will not be missed. The last incomplete slice is discarded.
- Aggregation function
- AVG - Average of all sample values from the given group
- PERCENTAGE - Average * 100
- SUM - Sum of all sample values from the given group
- TOTAL - Number of samples in the given group
- MEDIAN - Median of all sample values from the given group
- PERCENTILE(index) - Percentile of [INDEX] of all sample values from the given group.
Comparison
Compares the result of the aggregation (left operand) with the given threshold (right operand). The result is either FAIL or PASS.
- Fail if empty? - Some of the aggregation functions may yield empty results (for example Average of an empty group). If not checked, empty groups are evaluated as PASS.
et@sm - Firefox Driver Config
Removed in 1.7.0 (converts automatically to jp@gc - Firefox Driver Config)
To use the Selenium test (in Monitor test) and to measure an actual load time of the page in a separate browser window, it is necessary to define the configuration of the Driver. This component extends the jp@gc - Firefox Driver Config with evaluation of errors in JavaScript in the request. In order to evaluate occurred errors the Sampler et@sm - Web Driver Sampler should be used for Selenium script calls.
et@sm - Chrome Driver Config
Removed in 1.7.0 (converts automatically to jp@gc - Chrome Driver Config)
To use the Selenium test (in Monitor test) and to measure an actual load time of the page in a separate browser window, it is necessary to define the configuration of the Driver. This component extends the jp@gc - Chrome Driver Config with evaluation of errors in JavaScript in the request. In order to evaluate occurred errors the Sampler et@sm - Web Driver Sampler should be used for Selenium script calls.
et@sm - Selendroid Driver Config
This component allows to run a Selenium test on Android smartphones.
Samplers
et@sm - Web Driver Sampler
Extends standard jp@gc - Web Driver Sampler with the following features.
- Fail if JavaScript logs an error - sampler result is marked as failed if an error occurs in the browser Console (logging severity SEVERE).
- Calculate time statistics - pulls detailed timing data from the browser and displays it in sampler result. Mainly Page Time, Connect Time and DOM Time. See official PerformanceTiming API.
- Capture and export HAR - captures and exports HAR data to results folder. First you need to start BrowserMob Proxy and also configure proxy in Firefox/Chrome Driver Config (use manual proxy configuration option).
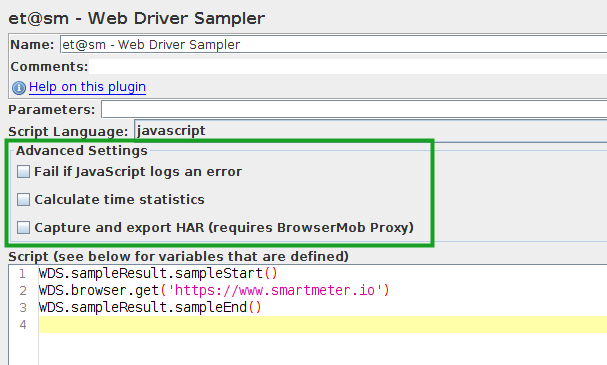
et@sm - AMF Request
Removed in 1.5.0
AMF is a protocol used by Adobe Flash and Flex. This component allows viewing and even editing of AMF requests. While performing the test, the AMF request is translated into a binary form. It is required by the AMF protocol. AMF requests are captured automatically while recording a web page with Flash or Flex technology. Request bodies are automatically converted from binary to text form.
Java Requests - cz.etnetera.jmeter.request.*
RunDataServer
Starts DataServer on the given port. The server is terminated once the test is finished.
Java requests are specialized components serving various purposes. Usually, a request accepts some parameters, perform its action and returns the result. Add requests as any other component - select Sampler / JavaRequest and choose the proper implementation.
DataServerImportRequest
This requests imports data to DataServer. It is a convenient replacement for hand-made HTTP GET request. See Data population for arguments description.
DataServerGetRequest
This requests retrieves and parses data from DataServer. It is a convenient replacement for hand-made HTTP GET request and CSV extractor. See Data retrieval for arguments description.
Note: There is one extra parameter variable names from DataServer [true/false]. If set to true, variable names will be obtained from the first line of the data source (CSV header).
RunBrowserMobProxy
Starts BrowserMob Proxy on the given port. The proxy is terminated once the test is finished.
Non-test elements
Components that can be added to "WorkBench" but are not directly related to a test execution.
et@sm - Recording log
See Recording log feature.
et@sm - Report Generator
Generates a test report from a log file (*.jtl).
- Test results - log file in XML format, by default located in SMARTMETER_PATH/results folder
- Test script - optional, source of additional information for test report, especially a source of acceptance criteria definition
- Time filter - select only a subinterval of test run
- Example 1 - offset start 600, offset end 3600 - select the subinterval from 10th to 60th minute
- Example 2 - offset start 600, offset end -600 - select the subinterval from 10th minute to test end minus 10 minutes
et@sm - Analyzer Summary Report
Component enabling a detailed analysis of already finished test. It retrieves the log of the test and fills all opened graphs and statistics windows with its information. This makes it possible to use modifications of displayed information to find details about behavior of the tested system.
- Filename - input field for entering address to the test log (jtl).
- Summary Report- table filled with values from the log. At the same time every opened window with graphs and statistics is filled.
- Loading result - an information window that appears after all the data from the log are loaded.
et@sm - Smart Proxy Recorder
See Smart Proxy Recorder feature.
Listener
et@sm - PerfMon Metrics Collector
This listener monitors system resources (CPU, RAM, I/O, disc usage, ..). If configured, it may also monitor system resources on generators, tested system or basically any other environment. The monitored system must have a perfMon agent installed and running. It always must be present in monitor script.
- Name - if the output is also inserted into the generated report, the graph will be named according to a value in this input field.
- Open in separate Window - button which allows to open the graph in its own new window. The position and size of the window is saved and after the next test windows opened the last time will be re-opened.
et@sm - Controller Summary Report
SmartMeter creates test reports based on this component. It is always present in the test script (if not explicitly, then it is added in the background). You can configure which data is saved.
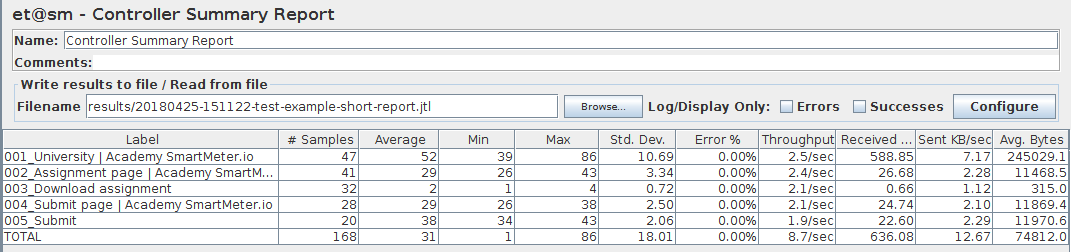
et@sm - Controller [...]
SmartMeter.io provides a further collection of listeners which begin with the et@sm - Controller prefix. These are widespread listeners that do not use distributed generators or communication between generators and Controller during the test.
Gotchas
Recorder does not open on Linux
Make sure that libgconf2-4 is installed. This is required by Electron.
View Results Tree is disabled
View Results Tree is perfect for script development but too resource consuming for serious testing and therefore it is automatically disabled in any distributed test.
Heap size configuration
Open Configurator, go to tab advanced and modify etn_editor_xmx, etn_controller_xmx and/or etn_generator_xmx properties.
Warning: This configuration has no effect in distributed mode!
Distributed mode
Configure directly in the monitor script. If load generators are started manually then edit bin/runGenerator script.
Example how to increase generator heap size up to 4 GBs in runGenerator script:
./SmartMeter.sh runGenerator -Xmx4g "$@"
Changelog
STABLE
v1.14.9 (2023-11-)
- [EDITOR]
- Enhance: Implemented automatic UTF-8 encoding conversion for test results
- [RECORDER]
- Enhance: Improved cleaning in logs for better clarity and readability.
- Add: Optimize performance and focus on relevant data.
v1.14.8 (2023-11-19)
- [EDITOR]
- Add: JMeter plugin
- backendlistener.elasticsearch
- Update: JMeter plugins
- jmeter-plugins-manager -> 1.10
- jmeter-plugins-casutg -> 2.10
- Add: JMeter plugin
- [RECORDER]
- Enhance: Automatic .json Extension to Saved Files
- Optimize: Request Handling
- Optimize: Recording Log
v1.14.7 (2023-11-12)
- [EDITOR]
- Update: Preprocessor for global variables
- Fix: Display ResponseBody in Recording log
v1.14.6 (2023-11-09)
- [EDITOR]
- Add: Preprocessor for global variables
- Update: log4j to v2.21.1
- Fix: vaadin.uiId
- [ELECTRON-SCRIPT-RECORDER]
- Update: Electron to v27.0.4 (Chromium 118)
- Fix: Recording log errors
v1.14.3 (2023-10-26)
- [ELECTRON-SCRIPT-RECORDER]
- Update: Upgraded Electron to version 27.0.2
- Bug Fix: Addressed issues with page loading when blocking reCAPTCHA
v1.14.2 (2023-07-19)
- [ELECTRON-SCRIPT-RECORDER]
- Update: Upgraded Electron to version 25.3.0
- Bug Fix: Corrected an issue on Windows 11 causing the recorder to fail saving tests
v1.14.1 (2023-06-09)
- [ELECTRON-SCRIPT-RECORDER]
- Update: Electron upgraded to version 25.2.0.
- Feature: Enhanced Web Navigation
- Added forward arrow button mimicking traditional browser navigation
- Added 'Go' button triggered by Enter key
- Feature: Privacy Enhancements (beta)
- Implemented tracker blocking to improve privacy
- Added functionality to hide pop-ups on webpages for a more seamless browsing experience
- Bug Fix: Resolved an issue where the SmartMeter Editor was initiating before the test was saved by the Recorder
v1.14.0 (2023-06-25)
- [ELECTRON-SCRIPT-RECORDER]
- Update: Electron upgraded to version 25, integrating Chromium 114.
- Feature: Improved request filtering
- Streamlined transactions by retaining only the most necessary ones.
- Excluded pseudo headers from requests, resulting in cleaner and more precise data.
- Feature: Enhanced transaction search
- Revamped transaction search functionality for lightning-fast results.
- Feature: Page Loading Optimization
- Feature: Improved test process saving
v1.13.1 (2022-12-31)
- [ELECTRON-SCRIPT-RECORDER]
- Bug fix: Transaction details not displaying
v1.13.0 (2022-12-24)
- [ELECTRON-SCRIPT-RECORDER]
- UPDATE: Updated and improved styles
v1.12.9 (2022-11-26)
- [ELECTRON-SCRIPT-RECORDER]
- UPDATE: Chromium 69.0.3497.128 -> 73.0.3683.121
v1.12.8 (2022-10-16)
- [ELECTRON-SCRIPT-RECORDER]
- FIX: Page screenshots in the Transaction panel
v1.12.7 (2022-09-18)
- [ELECTRON-SCRIPT-RECORDER]
- FIX: Displaying websites restricted to certain browsers only
v1.11.3 (2021-12-18)
- [GENERAL]
- FIX: bug fixes with Log4j Security Vulnerabilities
- FIX: bug fixes with distributed mode (user interface)
- FIX: bug fixes with Error Manager (UI Logging)
v1.11.0 (2021-05-07)
- [GENERAL]
- UPDATE: Update JMeter from 5.1.1 to 5.4.1
- UPDATE: Update included JMeter plugins to their latest versions
- jmeter-plugins-manager 1.3 -> 1.6
- jmeter-plugins-casutg 2.8 -> 2.9
- jmeter-plugins-webdriver 3.0 -> 3.3
v1.10.0 (2020-08-21)
- [GENERAL]
- CHANGE: updated java to Zulu jdk fx 11.0.7 from Oracle jre 8u202
- CHANGE: updated bin and monitor scripts
- [ELECTRON-SCRIPT-RECORDER]
- UPDATE: Update Electron from 1.8.2 to 4.2.12
v1.9.0 (2019-03-21)
- [GENERAL]
- UPDATE: Update JMeter from 5.0 to 5.1.1
- UPDATE: Update Java from 8u181 to 8u202
- UPDATE: Update included JMeter plugins to their latest versions
- jmeter-plugins-casutg 2.6 -> 2.8
- CHANGE: Remove programs/java symlink (Linux and macOS)
- [CORE]
- FIX: Fix transactions and HTTP requests naming in test plans created by Recorder
- FIX: Enable passing of -q (and also -p, -q, -j} JMeter parameter
- NEW: Add --sync parameter for generator startup to make it run in foreground
v1.8.2 (2018-12-09)
- [CORE]
- FIX: Fix error while Non-GUI distributed test is starting
v1.8.1 (2018-11-04)
- [CORE]
- FIX: Fix temporary results folder is writable check
v1.8.0 (2018-10-27)
- [GENERAL]
- UPDATE: Update JMeter from 4.0 to 5.0
- UPDATE: Update Java from 8u172 to 8u181
- UPDATE: Make SmartMeter.exe compatible with .NET 4.0
- UPDATE: Update included JMeter plugins to their latest versions
- jmeter-plugins-manager 0.20 -> 1.3
- jmeter-plugins-synthesis 2.1 -> 2.2
- jmeter-plugins-filterresults 2.1 -> 2.2
- jmeter-plugins-cmd 2.1 -> 2.2
- jmeter-plugins-casutg 2.5 -> 2.6
- jmeter-plugins-json 2.6 -> 2.7
- jmeter-plugins-webdriver 2.3 -> 3.0
- CHANGE: Remove Selendroid completely (looks dead for quite some time now, requires Selenium 2.x)
- CHANGE: Since JMeter 5.0, when using default HC4 Implementation, JMeter will reset HTTP state (SSL State + Connections) on each thread group iteration. If you don't want this behaviour, set httpclient.reset_state_on_thread_group_iteration=false
- CHANGE: Rename property host to internal.host to prevent possible collisions
- [CORE]
- FIX: Cannot create reports after updating jmeter-plugins-synthesis to 2.2
- FIX: Fix occasional race condition in GUI initialization (causing uninitialized Runner tab or duplicated Start test buttons)
- FIX: Fix old test runs used in Trends analysis if max limit is exceeded
- FIX: Fix perfMon graphs are missing in test report (for dist mode only)
- FIX: Fix first failed sample is not shown in Error Results Tree
- FIX: Set correct modify time on report folder
- FIX: Fix encoding of Responses Summary in test report for non ASCII chars
- FIX: Prevent generator from starting if a serializer is not initialized
- CHANGE: Rename column Hits per Second to Rate / sec in test report
- NEW: Add heap size info to Remote Info Window
- NEW: Show warning if low on disc (< 2 GBs) or low on heap (< 256 MBs)
- NEW: Add TERMINATED generator state to Remote Info Window (used if JMeter property server.exitaftertest is set)
v1.7.0 (2018-04-26)
- [GENERAL]
- UPDATE: Update JMeter from 3.3 to 4.0
- UPDATE: Update Java from 8u144 to 8u172
- UPDATE: Update included JMeter plugins to their latest versions
- jmeter-plugins-casutg 2.4 -> 2.5
- jmeter-plugins-functions-2.0 -> 2.1
- jmeter-plugins-manager-0.16 -> 0.20
- jmeter-plugins-webdriver-2.2 -> 2.3
- CHANGE: Remove Chrome Script Recorder (use Electron Script Recorder instead)
- CHANGE: Remove Chrome and Chrome Driver from Windows build
- CHANGE: Replace SmartMeter.command with Smartmeter.sh in macOS build
- CHANGE: Package Linux version as ZIP
- CHANGE: JMeter 4.0 uses Darcula theme as default (you can change in 'Options / Look and Feel' menu)
- NEW: Add comments for scripts in bin folder
- [CORE]
- FIX: Make passphrase for private key optional in SSHCreateSession Java command
- FIX: Property etn_reports_path cannot be overridden from CLI
- FIX: Use correct time units in Active Thread Groups section in report
- FIX: Recording log does not show method and body
- FIX: Error in log 'Can't compute checksum for saveservice properties file'
- FIX: Fix empty response data in distributed mode
- FIX: Trim DataServerGetRequest 'variable names' ('foo, bar' ==> [ 'foo', 'bar' ])
- FIX: Fix Recording log does not show responses for HTTP/2
- FIX: Do not remove temporary results files (distributed mode) if an exception occurs
- FIX: Do not auto-open Error Results Tree after test start
- CHANGE: Java command RunDataServer blocks until DataServer is started
- CHANGE: Change format of result file names [TIMESTAMP]-[TEST-SCRIPT-NAME]-report.jtl
- CHANGE: Rename softkillSmartMeter.sh (.bat) to stopSmartMeter.sh (.bat)
- CHANGE: Remove et@sm - SmartMeterHook component (not used)
- CHANGE: Add leading zero to decimal numbers < 1 in report (for example .6 becomes 0.6)
- CHANGE: Rename et@sm - Better response assertion to Range response assertion
- CHANGE: Remove et@sm - Chrome Driver Config and Firefox Driver Config (use standard jp@gc versions)
- CHANGE: Concurrency Thread Group (and alike) does not wait until all users finishes the test scenario - changed in jmeter-plugins-casutg 2.5
- NEW: Output report data in JSON to test-summary.json for further processing
- NEW: Show SmartMeter CLI properties (prefixed with sm.) in report
- NEW: Improved Trends Analysis in report (beautify, make ordering of test runs consistent, add overall averages)
- NEW: Move et@sm - Web Driver Sampler configuration from properties file to GUI
- [ELECTRON-SCRIPT-RECORDER]
- UPDATE: Update Electron from 1.7.9 to 1.8.2
- FIX: Fix removing URLs from autocomplete does not work
- FIX: Fix incomplete list of requests in Transaction detail
- FIX: Cannot manually change sleep time
- FIX: Prevent 'Fetch' type requests from automatically creating new transactions
- NEW: New app icon
- [DATA-SERVER]
- CHANGE: Change NO_RESPONSE to EMPTY_RESPONSE in DataServerGetRequest
v1.6.0 (2017-12-06)
- [GENERAL]
- UPDATE: Update JMeter from 3.2 to 3.3
- UPDATE: Update Java from 8u121 to 8u144
- UPDATE: Update included JMeter plugins to its latest versions
- [CORE]
- FIX: Fix warning "Problem creating registry: java.rmi.server.ExportException: internal error: ObjID already in use"
- FIX: Parameter password_file_path is ignored in monitor templates
- FIX: Fix parsing of percent values from CSV files while generating test report
- FIX: Handle CR/LF in SSH password file
- CHANGE: Deprecate et@sm - Distributed Lazy Stepping Thread Group, use et@sm - Distributed Concurrency Thread Group instead
- CHANGE: Stop processes spawned from load generators after test
- CHANGE: Set max number of attempts while creating SSH session to 3 (to prevent 'Too many authentication failures')
- NEW: Print test summary to console in Non-GUI distributed mode
- NEW: Log application errors to STDOUT
- NEW: Allow Save configuration of et@sm - Controller Summary Report
- NEW: Sent transaction name in et@sm - DynaTrace header
- [ELECTRON-SCRIPT-RECORDER]
- UPDATE: Update Electron from 1.6.11 to 1.7.9
- FIX: Fix opening test script after recording if saved without '.json' extension
- CHANGE: Add logging to file
- [DATA-SERVER]
- FIX: Fix starting DataServer with runDataServer.bat and runDataServer.sh
- CHANGE: Add logging to file
- NEW: Inform client about invalid charset of imported CSV file
- [WELCOME SCREEN]
- NEW: Add more SmartMeter Tips
- NEW: Remember last displayed SmartMeter Tip
- [CONFIGURATOR]
- CHANGE: Remove etn_close_monitor_after_test parameter (its closed together with Controller)
- NEW: Add etn_save_successful_sample_response_headers parameter
v1.5.0 (2017-09-01)
- [GENERAL]
- CHANGE: Request Free Trial license directly from Welcome screen
- CHANGE: Deprecate Light license
- UPDATE: Update JMeter from 3.1 to 3.2
- NEW: Add incubating Web UI
- NEW: Archive log files
- [CORE]
- FIX: Add pause between start generators and run test
- FIX: Optimize memory consumption if generating report without acceptance criteria
- FIX: Fix NumberFormatException while generating report if using ${__P()}
- FIX: Fix ArrayIndexOutOfBoundsException for empty response code in JTL
- FIX: Fix et@sm - DynaTrace Header for distributed tests
- CHANGE: Remove AMF sampler
- CHANGE: Hide et@sm listeners (use Runner tab)
- CHANGE: Configure Summariser to include transactions
- CHANGE: Remove CreateOracleDBPoolRequest
- CHANGE: Automatically insert et@sm - Controller Summary Report
- NEW: Add JMeter variable source to et@sm - Boundary Body Extractor
- NEW: Highlight requests by type in Recording log
- NEW: Number requests in Recording log to match numbering in test script
- NEW: Add view & download test script links to report
- [ELECTRON-SCRIPT-RECORDER]
- FIX: Fix starting Recorder on Windows 7
- FIX: Fix convertScript.bat to handle spaces in file path
- FIX: Stop test timer after clicking Save test
- CHANGE: Allow start recording when the tested site URL is invalid
- UPDATE: Update Electron to 1.6.11
- NEW: Select which domains to save after test recording
- NEW: Set HttpRequestDefaults according to the tested site URL
- [WELCOME SCREEN]
- NEW: Add SmartMeter Tips
- NEW: Add license type and expiration info
- [UPDATER]
- FIX: Fix SmartMeter update if temp folder is on different disc/volume
- NEW: Auto-start SmartMeter after automatic updates
v1.4.0 (2017-04-25)
- [GENERAL]
- FIX: Fix SmartMeter.sh script to resolve path if symlinked
- UPDATE: Update Java from 8u102 to 8u121
- UPDATE: Update Chromium (Windows only) from 54 to 57
- CHANGE: Remove versions file
- NEW: Add JMeter JSON plugins plugin
- [CORE]
- FIX: Fix reloading file in Recording log
- FIX: Fix link to documentation for Boundary body extractor
- FIX: Initialize only one ThrottleSamplerSender
- FIX: Fix long waiting for test end in some scenarios with et@sm - Distributed Lazy Stepping Thread Group
- FIX: Clear Controller when test script is loaded to Editor
- FIX: Fix multiple call of testEnded (possibly lead to generation of multiple reports)
- FIX: Fix premature termination of SSH tunnels
- FIX: Fix upserting parameters with the same prefix
- FIX: Show excluded samplers (by default [exclude]) in Error Results Tree if they failed
- CHANGE: Rewrite Recording log to extend from View Results Tree
- CHANGE: Change default for client.rmi.localport to random
- CHANGE: Do no append SCRIPT-NAME to report name if etn_report_name is defined
- CHANGE: Remove etn_report_template_path property
- CHANGE: Remove deprecated property etn_create_report_after_test_default
- NEW: Add custom start/end offsets (time filter) for report
- NEW: Add Trend analysis to test report
- NEW: Add generateReport scripts in Non-GUI
- NEW: Add batch report generation in Non-GUI
- NEW: Split variables names in DataServerGetRequest by either comma or semicolon
- NEW: Add link to Errors Overview records pointing to detail of error
- [CHROME-SCRIPT-RECORDER]
- FIX: Fix concurrency issue
- [ELECTRON-SCRIPT-RECORDER]
- FIX: Fix converting to static resources iterator with '?' in transaction name
- CHANGE: Preserve symlinks in Electron Script Recorder build to decrease build size
- CHANGE: Add .ttf to list of automatically detected static resources
- NEW: Automatic correlations for Vaadin framework
- UPDATE: Update Recorder to 1.1.4
- FIX: Several bug fixes in requests recording (especially in redirects)
- NEW: You can switch between automatic / manual transactions creation in the Recorder settings dialogue
- NEW: You can choose to record all requests in the Recorder settings dialogue (default option now)
- NEW: Recorder on OSX is correctly signed by developer certificate
- [WELCOME SCREEN]
- NEW: Add file dialog for selecting license file
- NEW: Automatic download of new license (if available)
- NEW: GUI improvements
- [CONFIGURATOR]
- CHANGE: Change color of changed values in Configurator from red to green
- NEW: Print global values in Configurator
v1.3.0 (2016-12-14)
- [GENERAL]
- UPDATE: JMeter updated to 3.1 from 3.0
- NEW: Add global configuration properties
- NEW: Add auto-updates
- CHANGE: Rename build package and folder to 'SmartMeter_VERSION_platform'
- CHANGE: Update run scripts to always 'cd' into SmartMeter Home folder first
- CHANGE: Change default thread group to et@sm - DistributedConcurrencyThreadGroup
- CHANGE: Remove 'data' folder, it is recommended to keep test data together with test scripts
- [CORE]
- FIX: Fix disabled button after repeated test run from Editor
- NEW: Add acceptance criteria definition and evaluation
- NEW: Start Server Agent for local tests
- NEW: Print test configuration (active thread groups settings) to report
- NEW: Add links to documentation for SmartMeter (et@sm) components
- NEW: Improve DataServerImportRequest to search for file relatively from test script
- NEW: Add result-collector.jmx to easily collect results from crashed tests
- NEW: Stop the test once the old log files are collected
- CHANGE: Change HTTP Cookie Manager from strict to standard (as recommended since JMeter 3.0)
- CHANGE: Generate report after test in Non-GUI
- CHANGE: Support et@sm - Synchronized PerfMon Collector in non-distributed tests
- CHANGE: Append script name to report folder name
- CHANGE: Add default metrics on Runner tab (for the first launch)
- CHANGE: Hide stacktrace output after test run in Non GUI mode
- CHANGE: Remove example Java requests for Oracle
- [SMART PROXY RECORDER]
- FIX: Fix missing 'modifiers_list' property to smart-proxy-recorder.jmx
- NEW: Add statically defined modifiers for Smart Proxy Recorder
- [WELCOME SCREEN]
- FIX: Fix FileNotFoundException if custom/smartmeter.properties does not exist
- CHANGE: Redesign test selectors to use standard file system dialog
v1.2.0 (2016-08-16)
- [GENERAL]
- UPDATE: JMeter updated to 3.0 from 2.13
- UPDATE: Java updated from 8u66 to 8u102
- UPDATE: Chromium updated from 48.0.2564.8 to 54.0.2824.2
- CHANGE: generator JVM's NewSize set to 64m and MaxNewSize set to 128m
- CHANGE: remove Selendroid-Standalone from build
- NEW: added brand New Recorder which is based on Electron by GitHub
- NEW: pre-installed JMeter Plugins Manager
- NEW: custom icons for SmartMeter applications
- [CORE]
- FIX: ConcurrentModificationException while adding new listeners during the test run
- FIX: ConcurrentModificationException in ControllerConcurrencyOverTimeGui
- FIX: path to recording log file (.jtl) is relative to test file (.jmx) now
- CHANGE: removed original SmartMeter test timer
- CHANGE: unset httpclient4.idletimeout=5000 (keep-alive)
- CHANGE: removed Concurrency related graphs from report's default setting
- CHANGE: deprecated et@sm - HttpRequest
- NEW: Recorder tries to run "chromium", "chromium-browser" or "chrome" (Linux only)
- NEW: free space info sent during log collection
- NEW: queue size info (how many sample batches are queued on generator) sent during test
- NEW: added details of each error in reports (data/errors)
- NEW: added "Errors overview" table report
- NEW: custom/libs added to classpath for external libraries
- [SMARTMETER PROFI]
- FIX: troublesome empty spaces in path to home folder and in names of test scripts
- CHANGE: generator exits after test if run on localhost (127.0.0.1)
- NEW: automatic forwarding of predefined parameters to Controller and generators
- [RECORDER]
- FIX: requests served from Chrome's on-disk cache are excluded now
- [WELCOME SCREEN]
- FIX: follow symlinks while loading test scripts
v1.1.1 (2016-05-23)
- [GENERAL]
- CHANGE: updated bin and monitor scripts
- CHANGE: renamed top level folder to match the archive name
- [CORE]
- FIX: results data are pruned for each successful request (not only for successful transactions)
- FIX: fixed occasional AWT deadlock in ShowInfoWindow
- FIX: UNDO/REDO function
- FIX: Response Times Percentiles graphs X axis description (after changing properties)
- CHANGE: added et@sm - DynaTrace Header preprocessor, removed etn_add_dynatrace_header parameter
- CHANGE: set httpclient4.idletimeout=5000 (keep-alive)
- NEW: added FIRST/LAST/RANDOM options for et@sm - Boundary Body Extractor
- [SMARTMETER PROFI]
- NEW: added PerfMon graphs configuration
- NEW: better support for load distribution (run thread groups on selected generators only)
- [CONFIGURATOR]
- NEW: added support for defining proxy (etn_proxy_host and etn_proxy_port)
v1.1.0 (2015-12-21)
Read blog post about v1.1.0 update.
- [SMARTMETER.IO PRO]
- FIX: recounting users for specific generators
- FIX: stopping the test does not corrupt generators (error message Engine is busy)
- FIX: BAT scripts are now executable from any folder
- CHANGE: runGenerator script (without any further parameters) starts generator with auto-detected RMI server hostname
- CHANGE: Monitor does not automatically close after test (configurable, for better integration with CI tools)
- NEW: new command line parameters runDistTest and runDistTestNonGui for running a distributed test
- NEW: running tests without monitor script (as SmartMeter.io Light does)
- NEW: running distributed test from Smart Proxy Recorder (see RunTest command)
- NEW: added runLocalGenerator script (RMI server hostname set to 127.0.0.1)
- NEW: added ComboBox for selecting monitor and test script separately
- NEW: added DataServerImportRequest and DataServerGetRequest Java request
- NEW: forwarding parameters from Monitor to Controller (use prefix -Jetnc_)
- [GENERAL]
- FIX: logging from libraries
- FIX: properly resized SmartMeter.io icons
- UPDATE: Java updated from 8u45 to 8u66
- UPDATE: JMeter plugins updated from 1.3.0 to 1.3.1
- UPDATE: Chromium updated from 39.0.2150.5 to 48.0.2564.8
- CHANGE: graphs HitsPerSecond, TransactionsPerSecond and ControllerBytesThroughputOverTime smoothed in final report
- NEW: extra parameters from CLI are forwarded to SmartMeter, especially useful for setting JMeter properties (-J prefix)
- [CORE]
- FIX: real-time results (Runner tab) does not add timers to response times
- FIX: SmartMeter.io HTTP client ignores MIME type of uploaded files
- FIX: etn_generator_xmx parameter is ignored
- FIX: Response Times Percentiles graphs X axis description
- FIX: static resources extensions are checked against URL path without query string
- CHANGE: Launcher does not terminate till SmartMeter.io exits (useful for CI tools)
- CHANGE: SmartMeter.io editor automatically opens last run (or default) test
- NEW: added shutdown hook (script which is called after test when SmartMeter.io exits)
- NEW: kill & softkill support from outside (useful for Non-Gui mode, CI tools, ..)
- NEW: generating report from command line
- NEW: Header Value Extractor component
- [SMART PROXY RECORDER]
- NEW: added support for starting from command line (for better integration with CI tools)
- NEW: added command Change recording target
- NEW: added command Add variable
- NEW: added parameter rampUp for command Start subtest
- NEW: support for automatic correlations
- [CONFIGURATOR]
- FIX: saving trailing spaces in Configurator
- NEW: added Reset to defaults option
- NEW: configurable maximum memory allocation pool for JVM (-Xmx) for Editor (etn_editor_xmx)
- NEW: configurable static resources extensions and types (etn_recorder_static_resource_extensions and etn_recorder_static_resource_types)
- NEW: configurable auto openning of report after its creation (etn_report_auto_open)
v1.0.5 (2015-09-09)
Read blog post about v1.0.5 update.
- [SMARTMETER.IO PRO]
- FIX: performance monitoring agent is started just once
- CHANGE: CMDDoCommandSynchronized renamed to CMDDoDeferredCommand
- NEW: new commands (RunLocalGenerator and SSHRunGenerator) for easier starting of generators
- NEW: new option for starting selected thread groups on selected generators only
- NEW: templates for monitor scripts for each common installation pattern
- [GENERAL]
- FIX: SmartMeter.command on OS X does not work with spaces in the path to SmartMeter folder
- CHANGE: Apache JMeter updated to 2.13 from 2.12
- CHANGE: JMeter plugins updated to 1.3.0 from 1.2.0
- CHANGE: jmeter.log renamed to editor.log
- CHANGE: distribution packages contains top-level folder
- NEW: added dock icon for OS X
- NEW: icons in multiple sizes (16, 32, 64, 128 and 256 pixels)
- [CORE]
- FIX: data for table showing "failed requests" in HTML report are correctly reseted between tests
- FIX: printing of failed requests to pictures in report
- FIX: et@sm ThinkTime component works correctly if min and max deviation equals
- FIX: generator is not started in NO-GUI mode anymore (it was unused)
- FIX: HTTP PUT and DELETE requests have empty bodies if using et@sm - HTTP Sampler
- CHANGE: all files related to reports moved to its own folder programs/SmartMeter/extras/report
- NEW: Smart Proxy Recorder
- NEW: integration with JMeter-WebSocketSampler plugin (https://github.com/maciejzaleski/JMeter-WebSocketSampler/releases) for testing web sockets
- NEW: new button for starting the test directly from Edtior
- NEW: graphs in report are automatically added to HTML report (no need to modify the report.html template)
- [RECORDER]
- CHANGE: characters are no longer automatically escaped when defining boundaries for replacers and automatic correlations
- CHANGE: RecorerInterfaces.jar moved to programs/SmartMeter/extras
- NEW: new input box for easier setting of include pattern
- NEW: source codes for Recorder extension API (RecorderInterfaces.jar) added to build
- [WELCOME SCREEN]
- NEW: Light/Pro version is displayed next to build version
- NEW: recursive loading of tests from the tests folder
- NEW: tests are reloaded from the file system if the Settings panel is shown/hidden
- [CONFIGURATOR]
- FIX: fixed typos
- CHANGE: property 'etn_report_create_graphs' was removed, it is no longer necessary
- NEW: new field for extra configuration of report graphs
v1.0.4 (2015-06-09)
Read blog post about v1.0.4 update.
- [CORE]
- FIX: fixed Runner initialization which occasionally failed
- FIX: fixed thread counting - only those threads which exceeds the whole thread run time are counted
- NEW: generator arguments can be added / overrided from command line (Editor)
- [GENERAL]
- CHANGE: updated to Java8 (update 45)
- [RECORDER]
- FIX: fixed the loading of Recorder plugins in Chrome / Chromium on Linux and OS X if the browser was previously started by user
- CHANGE: changed Recorder server STOP port from 8010 (possibly occupied by XMPP) to 27222
- NEW: captures bodies of HTTP PUT requests
- [CONFIGURATOR]
- NEW: separate configuration of Light and Pro version
- NEW: easier customization of graphs
- NEW: new configurable -Xmx parameter for both generator and controller (Light version)
- NEW: copyable default values and examples
- NEW: optimized look in Linux