Performance Trend Analysis: Compare Load Test Runs at a Glance
Trend analysis allows you to compare results from previous test runs to get a clear overview of performance trends. Let’s take a look.
The feature works out of the box. SmartMeter.io automatically detects previous test runs in report folder and uses them for comparison.
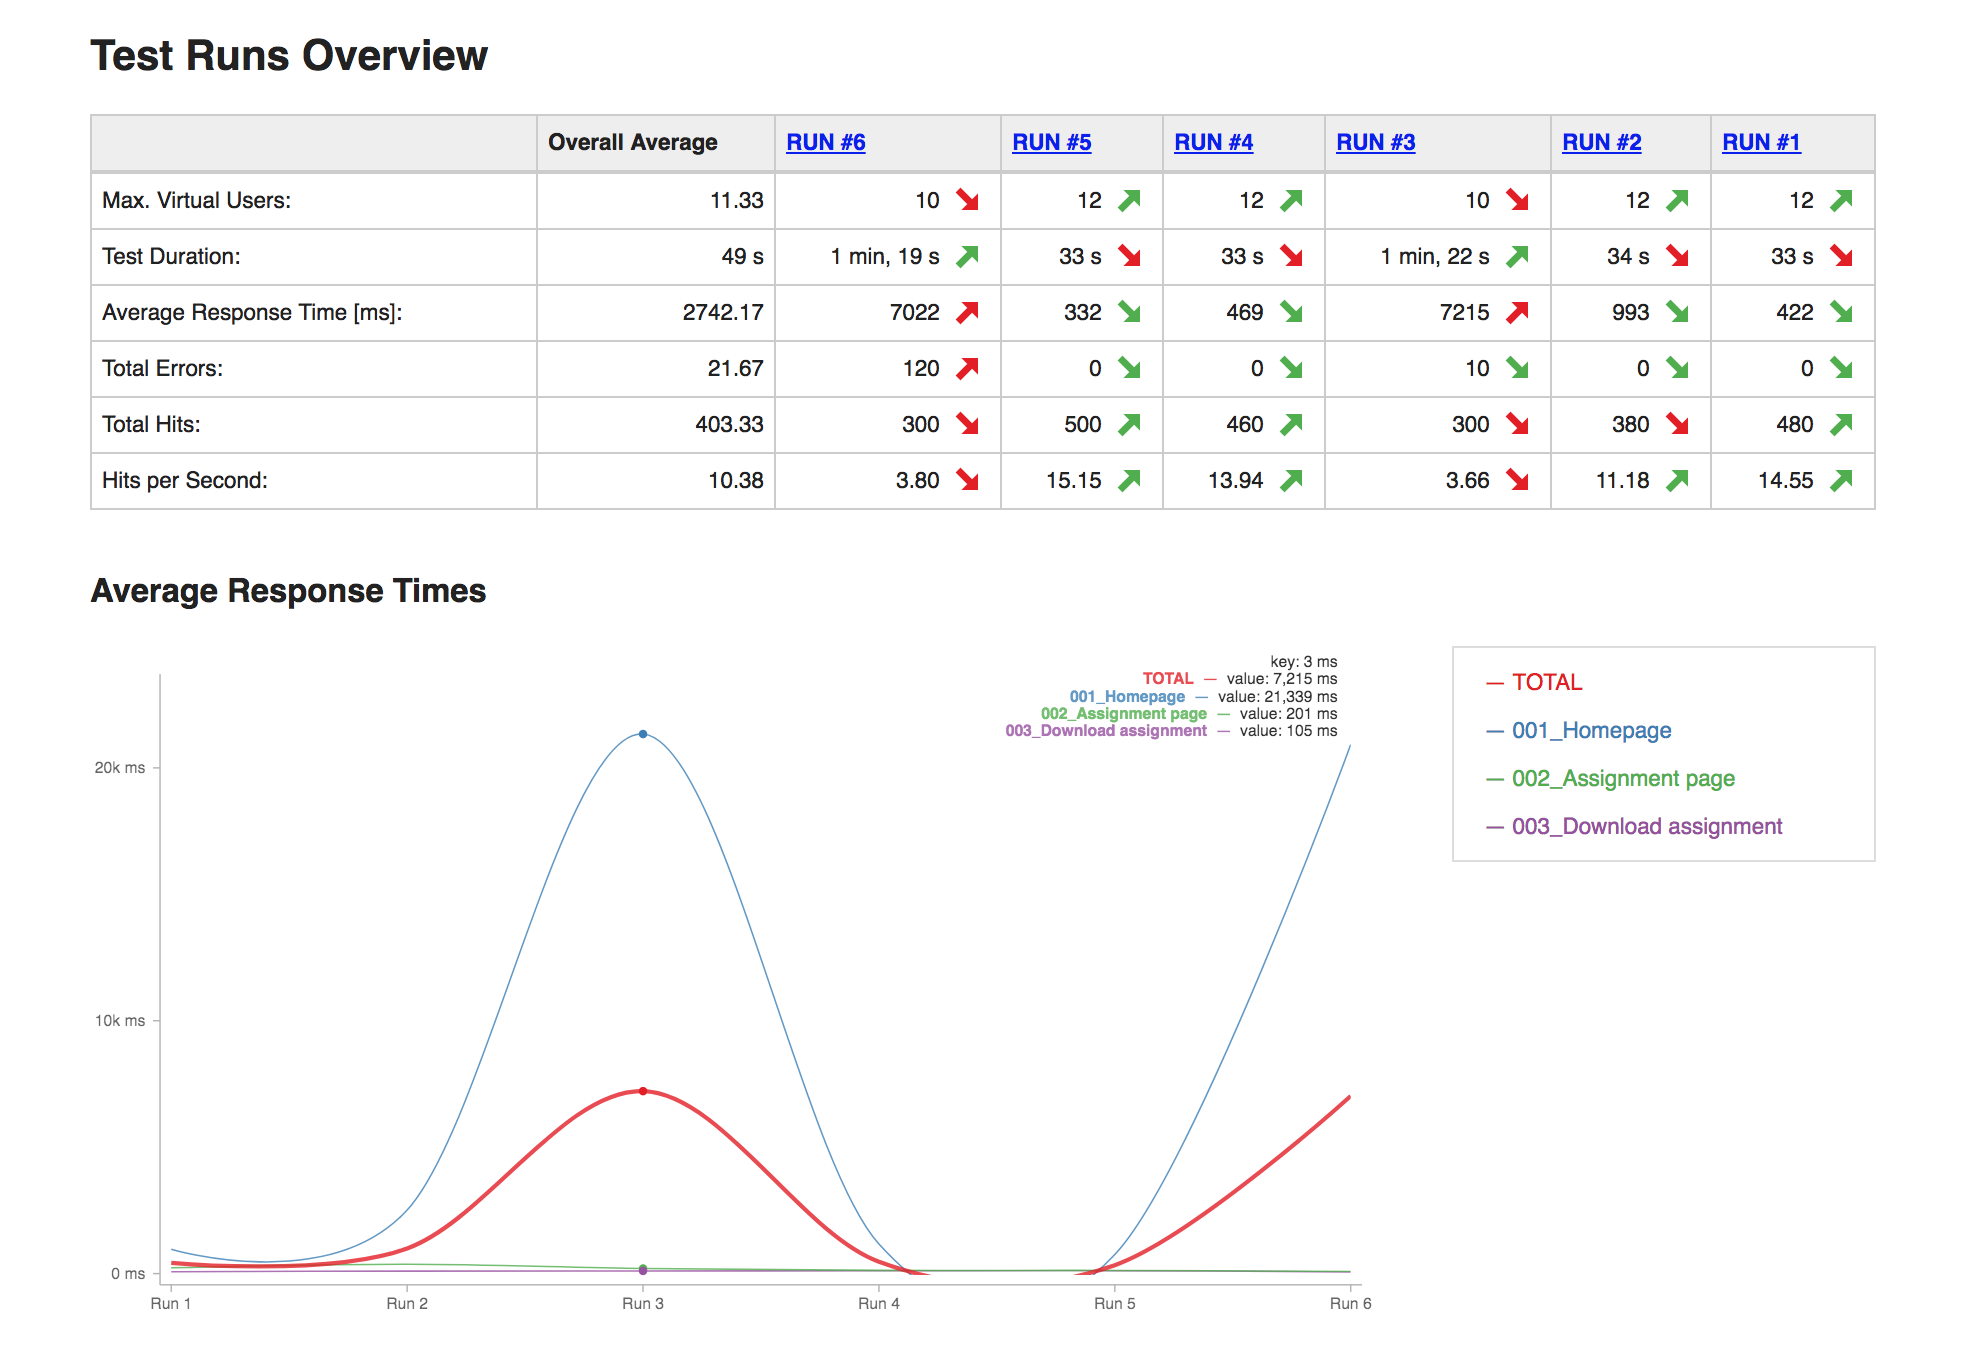
Trend analysis table
The table shows how the results changed from previous test run to give you an instant overview.
The table contains following metrics:
-
The maximum number of reached virtual users
-
Test duration
-
Average reponse time
-
Total errors
-
Total hits
-
Hits per second
Comparison charts
For each transaction in test scenario there is a comparison chart for following metrics:
-
Average Response Times
-
Median Response Times
-
Error Rate
Settings
Test runs are grouped by test script name (.jmx file). In case of major changes in the test script we recommend to version its name to start over.
If you want to exclude a test run from comparison, either remove the whole report folder or delete the data/test-summary.json file from it. Then generate the last report again.
